CLP Latency Monitors 
1. Overview 
APDEX scores are computed based on metrics and logging from different sources – for the most part this is either from the OpenSearch-based CLP clusters, or from Apache Pinot.
In this page we are only concerned with monitoring latency in source data in the CLP clusters.
2. Context 
Applications will generally be running servers somewhere and generate logs and/or metrics files on the file system. The servers have logstash (or – probably more accurately -- FileBeat) that will read those logs and stream that to an appropriate Kafka topic.
 When we detect latency in the source data over a certain threshold we trigger a pagerduty alert so we can investigate that.
3. Monitoring 
APDEX CLP monitoring is done by the STAP application – specifically the 'ES Task' module.
There are three monitoring tasks:
These jobs run once an hour in STAP.
(Note: for FedRAMP you will need to access https://stap2.webex.com/ from within the Windows Remote Desktop environment.)
Monitoring jobs should send PagerDuty alerts to the CEO-MSQ-Services-high PagerDuty Service.
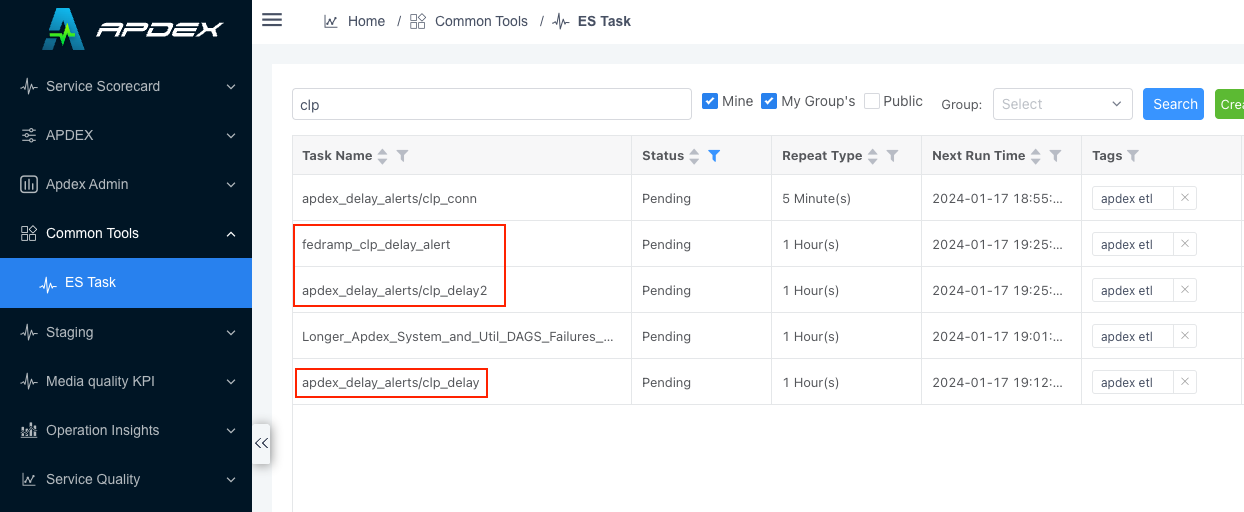 (https://stap.webex.com)
4. Investigating an alert 
Briefly, the procedure for treating these alerts is:
- Identify the data center and CLP component
- Check the source data to verify that the problem is actually happening there
- Bring it to IC's attention if there is clearly a gap in data (this is almost always the case)
- If the problem isn't in the source then the problem may be on our end.
What the alert looks like 
The pagerduty alert will have a message that looks like this:
CLP delay detected (excluding telemetry_event on yyz02, telemetry_event on ams02, and telemetry_mediastatus on ams02)

What you want to look for in the alert is the following:
1) tags.clp_monitor_group.keyword -- This tells you which monitor group the problem was in 2) tags.clp_dc.keyword -- this tells you which CLP DC the latency was detected in 3) last_check_time -- this should give you a rough time when the problem happened.
| dc | tags.clp_monitor_group.keyword | tags.clp_dc.keyword | count | min_latency | last_check_time | max_latency |
|---|---|---|---|---|---|---|
| SJC02 | meeting_logs_spark | jfk | 29.0 | 5272.0 | 2023-04-08T21:22:37.000Z | 6810.0 |
You can identify the CLP component using the monitoring group. The authoritative source for this information is in the airflow-tasks-apdex repo in ~/dags/apdex/util/monitor/clp_monitor_groups.py. The information is summarized here for convenience though.
| Monitor Group | CLP Component | Index | Test Query |
|---|---|---|---|
| meeting_logs_spark | meeting | logs-clap_*-meeting-* | kafka_meta:*_logstash_meeting_spark_clp |
| meeting_logs_webex | meeting | logs-clap_*-meeting-* | kafka_meta:*_logstash_meeting_webex_clp |
| meeting_metrics | meeting | metrics-clap_*-meeting-* | kafka_meta:(*_logstash_meeting_hdfs OR *_logstash_meeting_gdm_nifi) AND NOT type:(anxsvr OR gpssvr) |
| callanalyzer_result | callanalyzer | metrics-clap_*-callanalyzer-* | type:cainwebex AND _exists_:result |
| callanalyzer_cascade | callanalyzer | metrics-clap_*-callanalyzer-* | report.name.keyword:cascade_setup_report |
| telemetry_event | telemetry | metrics-clap_*-telemetry-* | _exists_:values.extVal.type |
| telemetry_mediastatus | automateddiagnostics | metrics-clap_*-automateddiagnostics-* | kafka_meta:*_mediastatus_telemetry_hdfs |
| wmequality_report | mediaqualitydata | metrics-clap_*-mediaqualitydata-* | kafka_meta:*_mqa_telemetry_wmequality_report |
| cascademq_report | cascademqreports | metrics-clap_*-cascademqreports-* | kafka_meta:*_mqa_mediaqualitydata_cascade_mqreport |
| telephony | telephony | metrics-clap_*-telephony-* | kafka_meta:*_logstash_telephony_hdfs |
| ucre_cp | ucre | "logs-clap_*-ucre-* | kafka_meta:*_logstash_ucre_webex_clp_hdfs |
| csp | csp | metrics-clap_*-csp-* | kafka_meta:*_logstash_csp_hdfs* |
Check CLP 
The first thing to do is to check if we see a gap in data in the relevant OpenSearch cluster. You can take the query we use and check to see if there is a clear drop off in data.
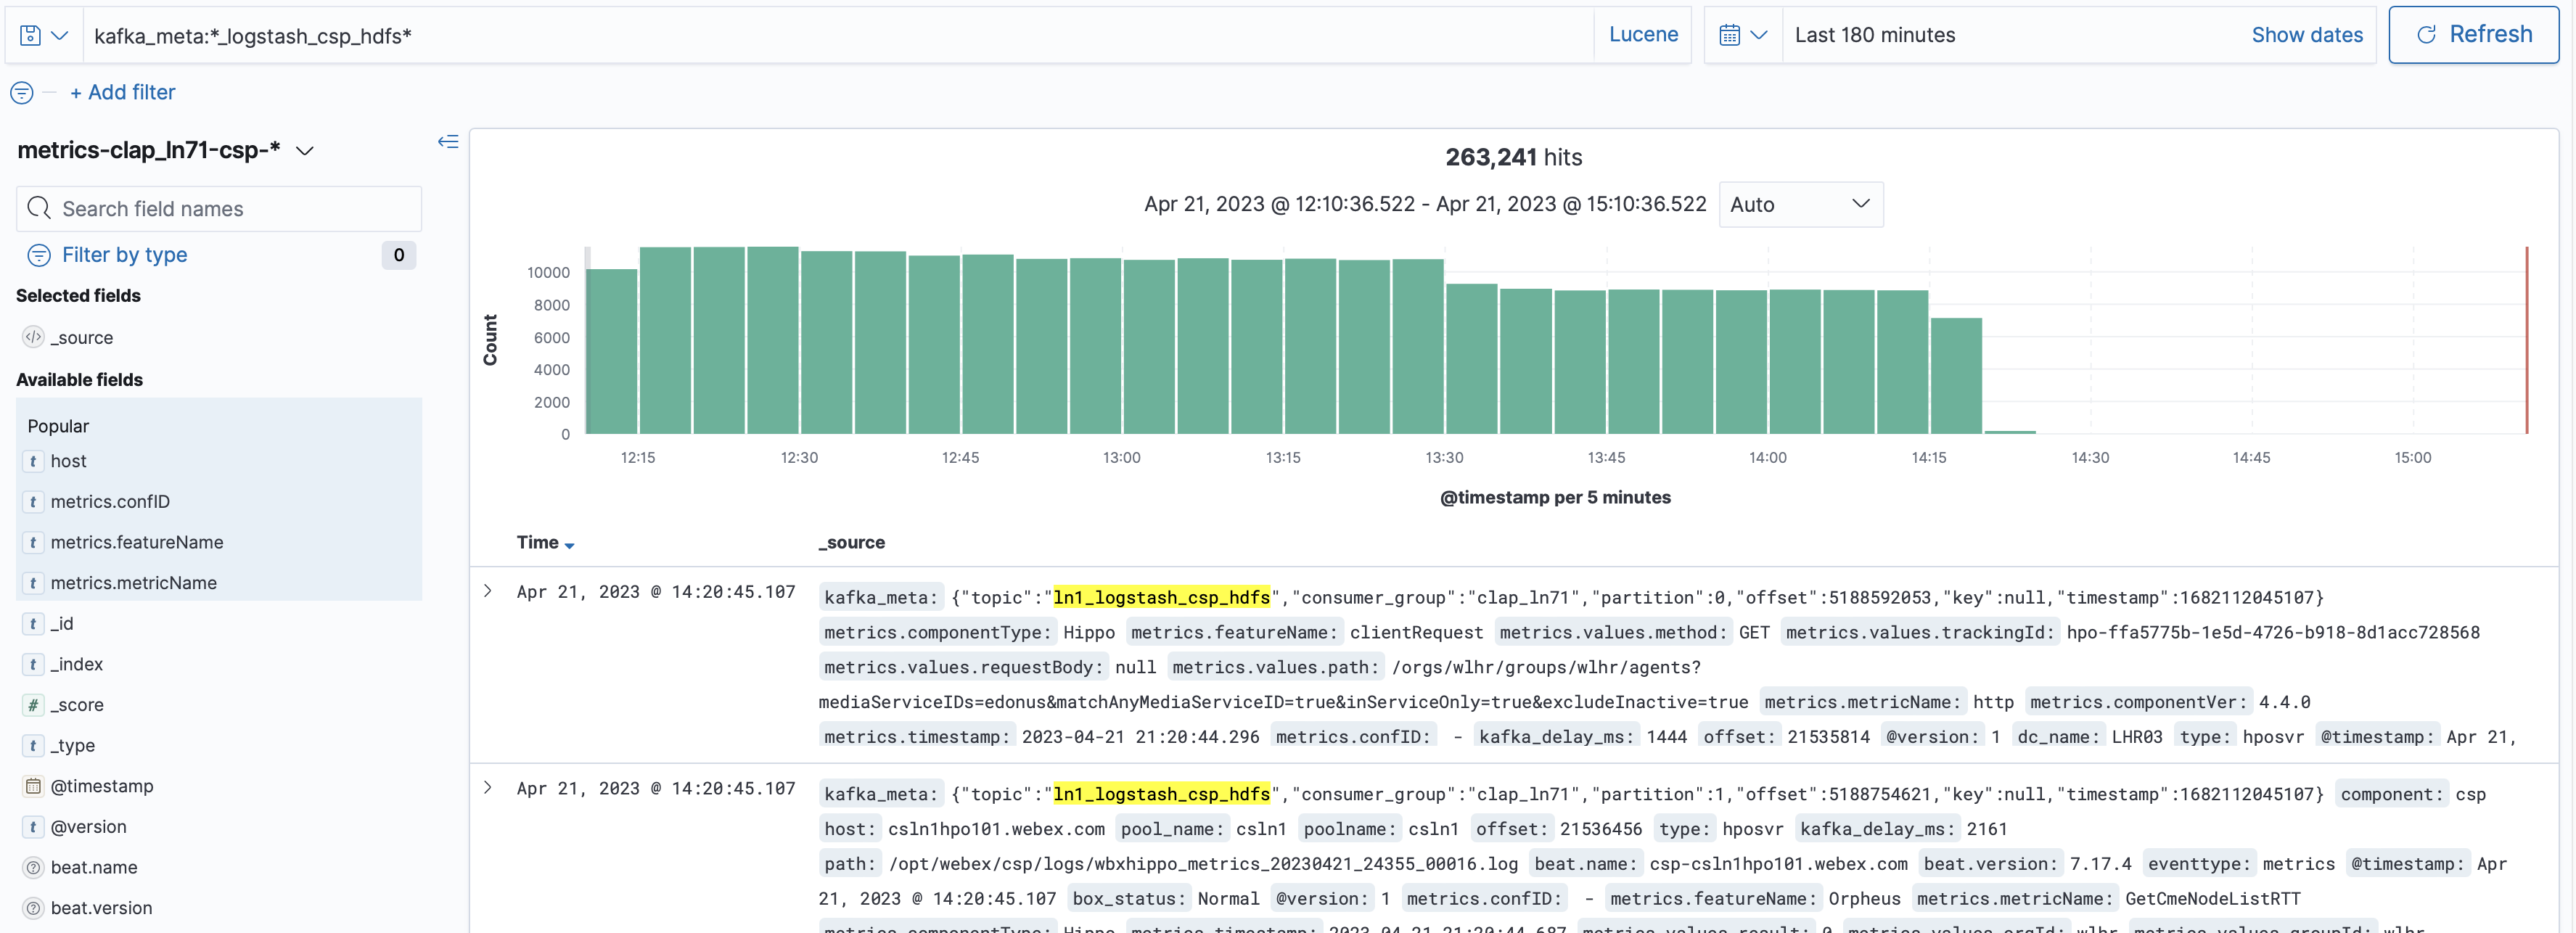
If such a drop-off exists you can further remove the specific query we use and check if all data has stopped flowing into the cluster.
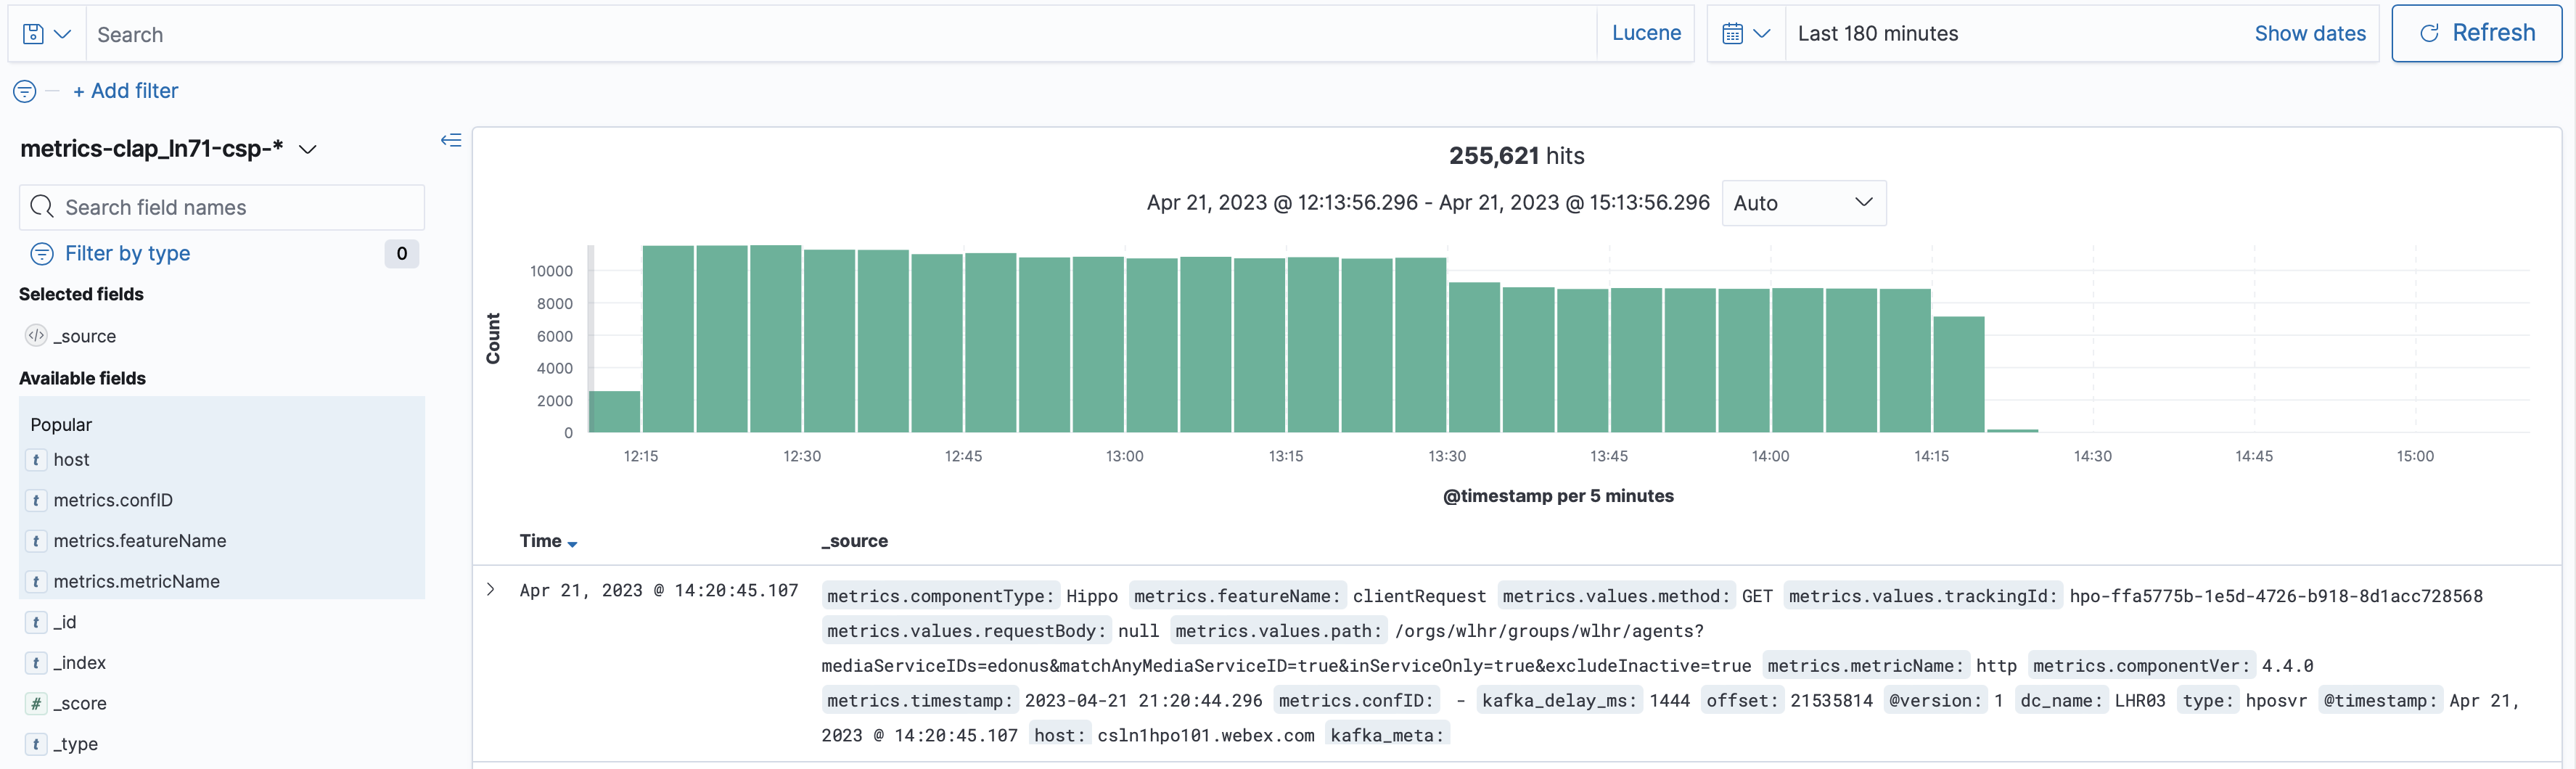
In this case you can consider creating an incident. If there is other maintenance going on then you could hold off -- or simply inquire about this in the 'DAP Queries SOC' Teams Space.
Other potential issues 
If the data appears in CLP fine but we have this alert, then there may be an issue with our ability to query that particular cluster.
In this case you should check the logs for our DAGs that query on this cluster in Airflow. They should be showing red to indicate a failure.
Look specifically at the 'pull_and_handle_clp_{dcname}' task -- where the dcname is the one you identified from the alert. The log should list our OpenSearch queries and you can scroll down and you will probably see a Python call stack. For example you might see something like this:
[2023-04-21 22:51:29,264] {base.py:259} WARNING - POST https://clpto-csp.webex.com:443/elasticsearch/metrics-clap_*-csp-*/_search [status:401 request:11.929s]
[2023-04-21 22:51:29,264] {taskinstance.py:1463} ERROR - Task failed with exception
Traceback (most recent call last):
...
opensearchpy.exceptions.AuthenticationException: AuthenticationException(401, 'Authentication finally failed')
[2023-04-21 22:51:29,268] {taskinstance.py:1506} INFO - Marking task as FAILED. dag_id=apdex.csp.otter.endonus2otter, task_id=pull_and_handle_clp_yyz02, execution_date=20230421T224600, start_date=20230421T225116, end_date=20230421T225129
Authentication failures 
In the example above our Airflow job encountered a failure to query OpenSearch. It isn't unusual to see the occasional failure but if we see this consistently then that would be a problem with our generic account being able to connect to opensearch.
You can use the msq_esapi.gen account when logging into the CLP OpenSearch Dashboard to manually verify if this is failing.
For consistent failures of this kind you can ask in the DAP Queries SOC team space to see why that might be failing. You might simply start with : "Hi Team, we are seeing some consistent failures with LDAP connections to the {component} CLP OpenSearch cluster in {dc name}, anything going on ?"
5. Starting an incident 
To start an incident for a CLP latency issue, use the Incident Command bot.
IC /incident create
For the Incident title we try to summarize three things:
1) Which datacenter 2) Is this FedRAMP or not (just omit 'FedRAMP' if this is a Commercial issue) 3) Timestamp that data started to no longer appear in Kibana.
ie..

or

Incident Command has a boiler-plate heading to start gathering certain information to triage incidents.
• Evidence : If you have any metrics or logs that can highlight the issue, please post them now.
-- This is where we generally include a screen shot of the Kibana Discover pane window showing the drop in logging.
-- It is also good to include a link to this too.
• Customer Experience (Urgency) : What end product/products are affected? What feature is affected and is the feature fully broken or impaired.
-- Pretty much the impact is on APDEX logging and doesn't impact customers. This is important to state for IC.
• Impacted Environment : What region/regions are affected by the issue?
-- Which DataCenter and CLP Component
• Impact Level : Who are affected or not affected by it (user profile)? What level of users are affected (roughly with % if available)?
-- Impacts APDEX monitoring.
• Customer Cases : How many known customer cases are caused by this incident?
-- N/A for us.
• Suggested Mitigation : if you know the team/service needed to mitigate please post details
This is where you can make some informed guesses about how to proceed – which takes us to the next section.