Logstash Heartbeat alert 
Logstash is used to copy APDEX and other data from our database to our OpenSearch clusters. To monitor the health of this part of our data flow we have a particular monitoring job that tracks a regular bit of data that should be copied from our database to our OpenSearch. If there is ever a failure on either the database end in writing to an OpenSearch cluster this alert should get triggered.
What the alert looks like. 
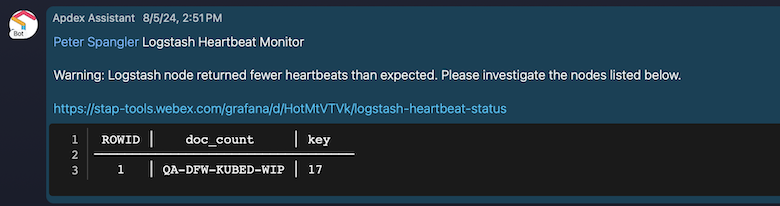
A sample alert from our APDEX ETL Pipeline Teams space is shown below. The main bit of information that you need is the middle 'key' column, which identifies which Logstash you need to look at. The pagerduty alert has the same information.
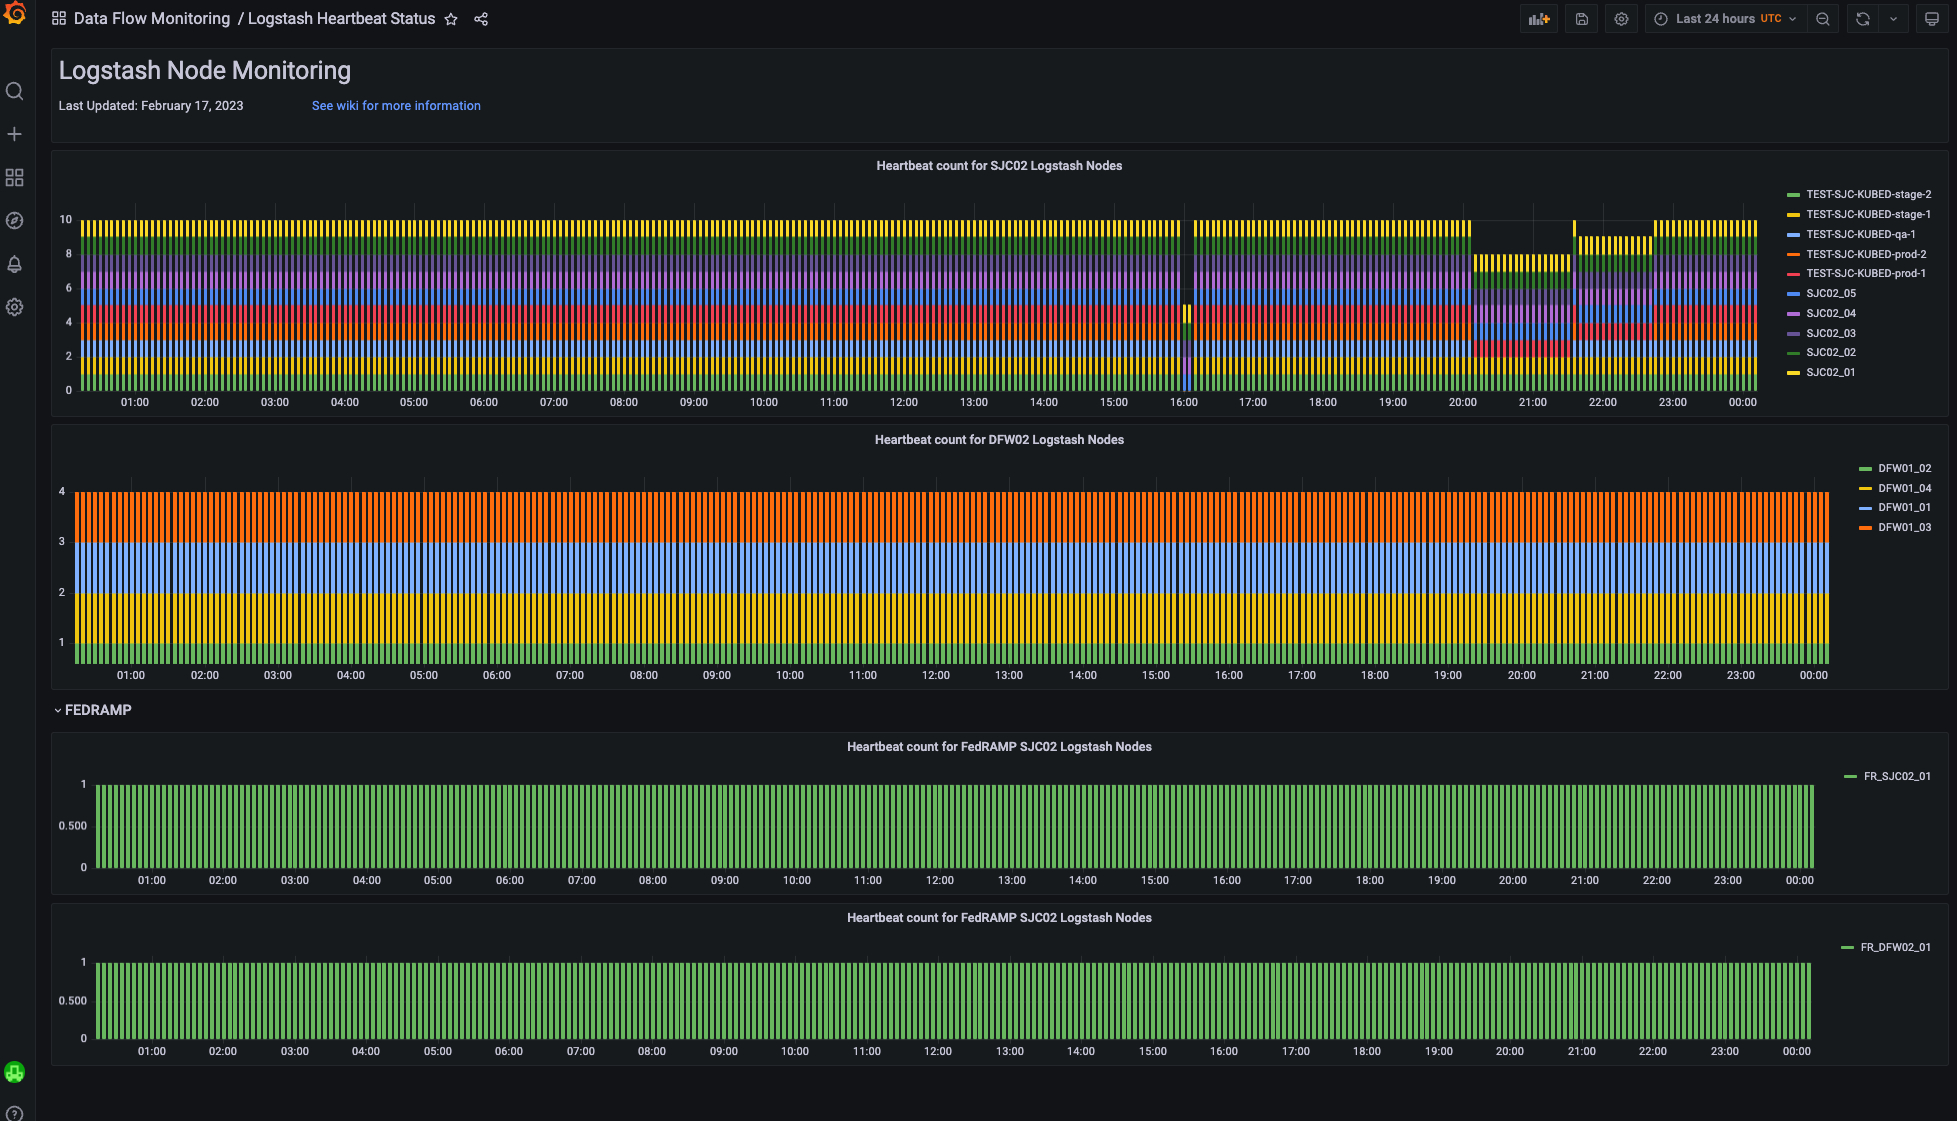
If you go over to our Logstash Heartbeat dashboard you should see which logstash nodes are failing and when that started, and also if it recovered. The top two panels reflect the status of our Commercial Logstash nodes -- both in OCP and in Kubed. The bottom two panels cover our FedRAMP nodes.
Handling the problem 
The key label will tell you which node to look at: * Anything with KUBED in the name will point you to the WebexKubed cluster. * The three-letter DC code prefix tells you which datacenter. * The rest of the string tells you the specific node to look at.