Pinot Latency Monitor 
The pinot-based APDEX features are the next most common after the CLP-based ones. Apache Pinot
We have a monitor that will check different tables in our Apache Pinot data store. You can view the Pinot panel in our APDEX Data Latency dashboard.
Alerting Definition 
1. What the alert looks like 
A sample Pinot alert is pretty simple.
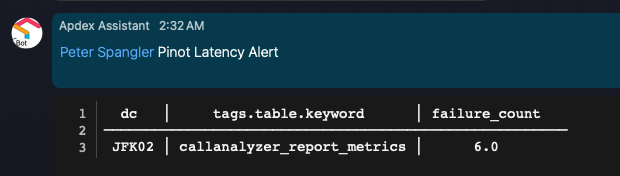
| dc │ tags.table.keyword │ failure_count |
|---|
| JFK02 │ callanalyzer_report_metrics │ 6.0 |
The main thing to look for is the Pinot table that was being queried. In this example it is the callanalyzer_report_metrics table.
Note: The 'JFK02' is NOT the Pinot data source but really references the STAP ESaaS that this query result came from in the alert. You can ignore that.
2. Check Pinot 
To check on Pinot you should go to the Staging WAP Grafana.
https://wapgrafana-staging.webex.com/explore?orgId=1
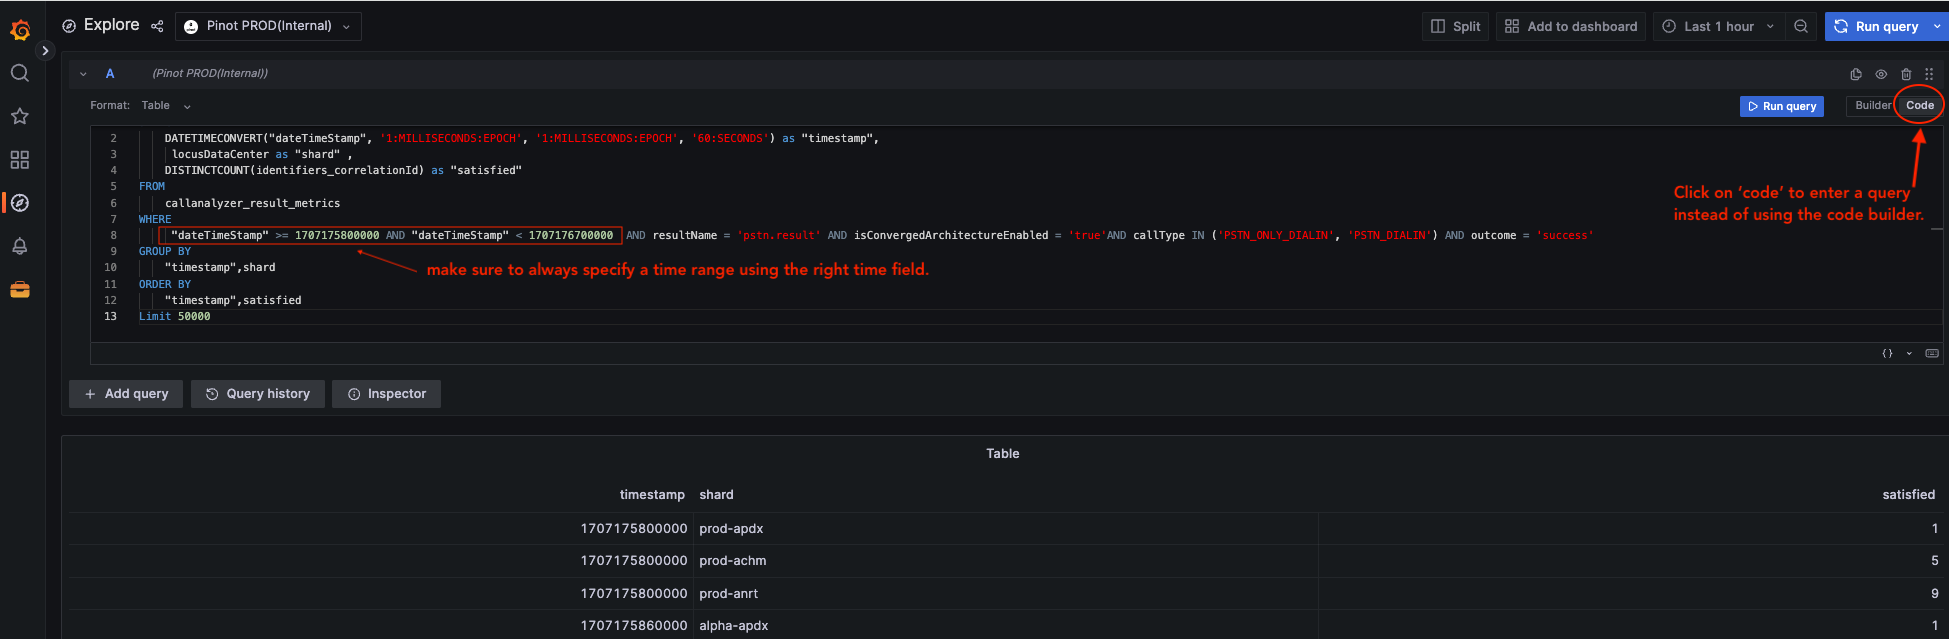
One recommendation is to go to an APDEX DAG for Pinot and get a query from the logs to use, and then adjust the time as needed.
SELECT
    DATETIMECONVERT("dateTimeStamp", '1:MILLISECONDS:EPOCH', '1:MILLISECONDS:EPOCH', '60:SECONDS') as "timestamp",
     locusDataCenter as "shard" ,
    DISTINCTCOUNT(identifiers_correlationId) as "satisfied"
FROM
    callanalyzer_result_metrics
WHERE
     "dateTimeStamp" >= 1707175800000 AND "dateTimeStamp" < 1707176700000  AND resultName = 'pstn.result' AND isConvergedArchitectureEnabled = 'true'AND callType IN ('PSTN_ONLY_DIALIN', 'PSTN_DIALIN') AND outcome = 'success'
GROUP BY
    "timestamp",shard
ORDER BY
    "timestamp",satisfied
Limit 50000
If you see a gap in data you can ask about this in the Ask ROMA teams space.