How to create your first Apdex alert 
First things first, why should you set up alerts on Apdex? There is a significant difference between the alerts set on Apdex and those set on internal system status (such as CPU utilization): the former are effect-oriented, while the latter are cause-oriented.
The cause-oriented alerting approach excels at pinpointing which part of a system is experiencing a problem, but it has several drawbacks:
- It requires setting lots of alerts, which can be time-consuming. In a complex system, a slowdown or malfunction at any location can potentially lead to a significant decline in the service quality of a function or feature. Therefore, system owners need to set alerts at all potential points of failure.
- It is prone to have blind spots. When dealing with a complex system, it is extremely difficult to achieve complete coverage without any blind spots. As a result, system owners may not become aware of a problem until it is reported by customers.
- It can be difficult to determine appropriate thresholds for alerts. Different functions or features may have varying tolerances, making alert thresholds often either too sensitive or too insensitive.
- It is prone to having alert storms, where a slowdown or malfunction at one location may trigger a chain reaction and cause a large number of alerts to be fired at multiple locations, making it difficult to pinpoint the root cause.
- There will inevitably be false alerts. System owners often consider an alert to be false when there is little to no impact on user experience. False alerts can occur due to overly sensitive thresholds or maintenance activities. In a complex system, it can be challenging to eliminate these false alerts as it is difficult to find the optimal thresholds or predict the impact of maintenance activities on various parts of the system.
- It can be difficult to distinguish real alerts from false ones. Cause-oriented alerts can identify which part of a system is problematic, but they cannot provide information about which features and users are affected and to what extent. As a result, system owners may struggle to differentiate between true and false alerts, leading to either overreaction or a lack of understanding about the severity of the problem until it is reported by customers.
In contrast, the effect-oriented (Apdex-based) alerting approach doesn't provide information about which part of a system is problematic, but it has several advantages over the cause-oriented approach:
- It requires fewer alerts to be set, as Apdex measures the user experience of functions or features provided by a system and there are typically far fewer features than potential points of failure.
- It is easier to eliminate blind spots, as there are fewer alerts to set.
- It is easier to determine appropriate alert thresholds, as Apdex provides information on which feature is experiencing service degradation and how many users are affected, allowing thresholds to be set on the number of impacted users.
- It is less likely to trigger alert storms due to the reduced number of configured alerts.
- It is easier to eliminate false alerts, as alerts are configured based on the number of users experiencing service degradation.
- There is no need to distinguish real alerts from false ones once false alerts have been eliminated.
How Apdex Alerting works 
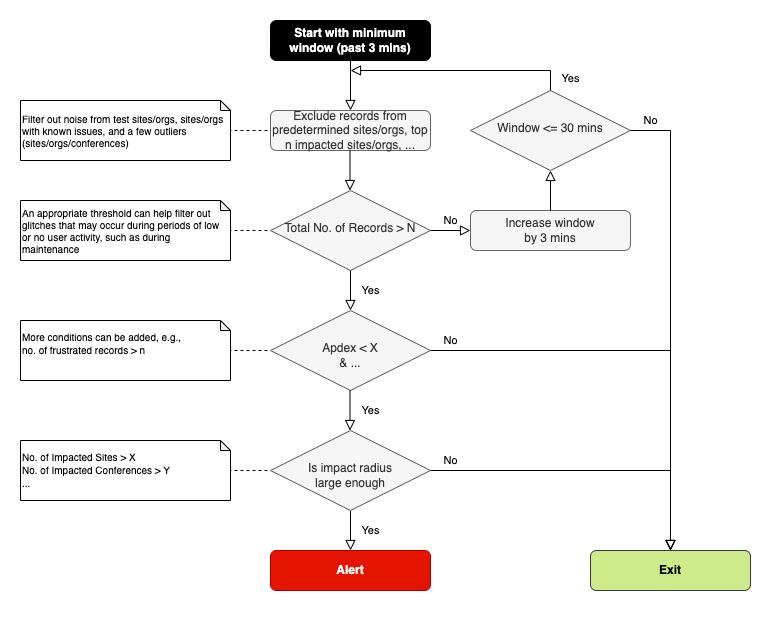
In simple terms, Apdex alerting detects dips in Apdex scores, which indicate service degradation, and evaluates their severity. An alert will only be triggered if a sufficient number of users are affected. The scanning window for Apdex alerting adapts dynamically to gather enough data. Additionally, system owners have the option to filter out noise from testing activities and problematic customers. The following diagram provides a more in-depth explanation of the process.
Setting up your alert 
You can see existing APDEX features with their associated Alerting tasks and create your own in the Apdex Apdex Definitions and Alert Criteria page.
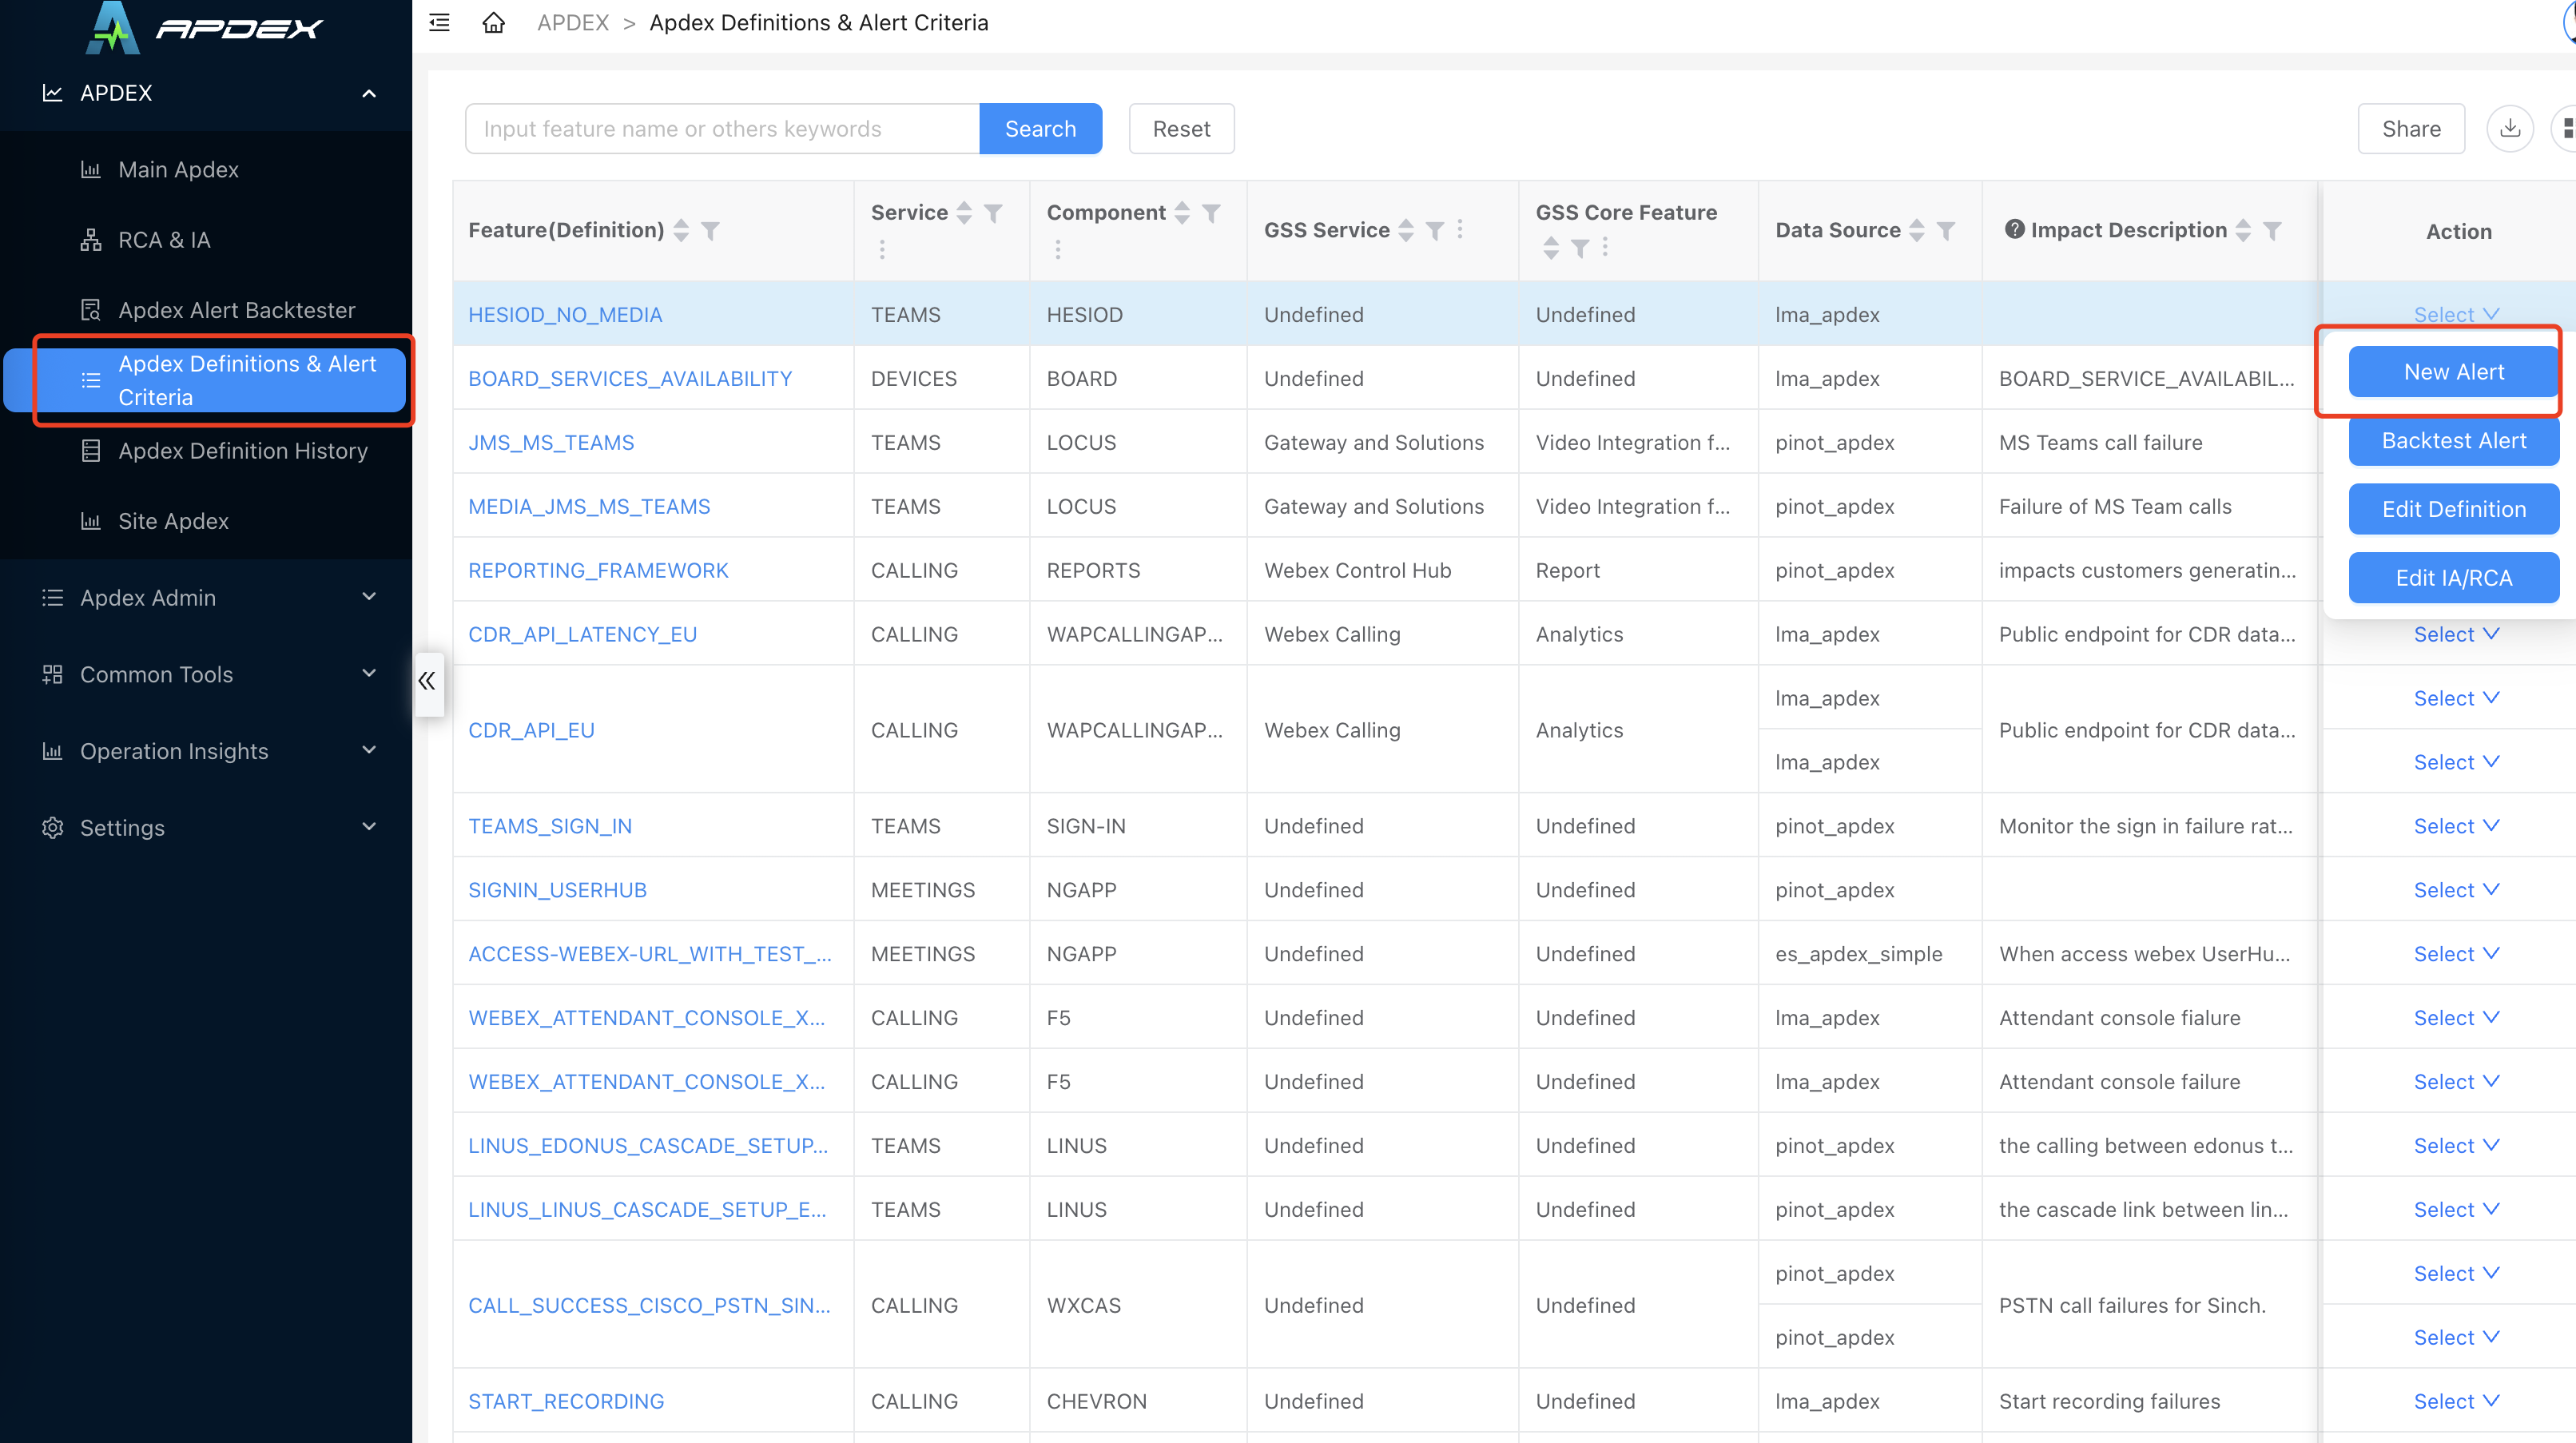
When you have a new APDEX feature there won't be an existing alert yet, so you would create a new alert criteria. You can also create more than one Alert associated with a given APDEX feature.
Under the 'Action' menu you'll see the options to add new criteria, edit existing criteria, as well as edit the Impact Analysis (IA) and Root Cause Analysis (RCA) configuration (more to say about that later.)
| Step 1 | Step 2 | Step 3 |
|---|---|---|
| Define the task name and how often to run. | Set the APDEX criteria | Review and Save |
| Set Alert subject and message body | Minimum number of total records before sending an alert | |
| Identify where to send an alert – PagerDuty, Email, a Webex Teams Space | Number of frustrated records | |
| Number of impacted conferences | ||
| Number of impacted sites | ||
| Whether to include a link to Frustrated Links in Kibana, or to enable impact analysis and root cause analysis pages |
Step 1 – Notification Options 
Task names are required. These have to be composed of alphanumeric characters and underscores – no space characters.
Start Time allows you set when to start an alert. You might set this in the future as needed but mostly you will use the default (current time) value.
Recurrence controls how frequently your task should run. Initially you might set this to NoRepeat until you want to put this into regular use. You can manually run a task while still refining the criteria.
Notification Channels 
The bottom section of this dialog box lets you control where an alert gets sent. This would be equivalent to the Contact Points in Grafana, for instance.
Webex Teams options

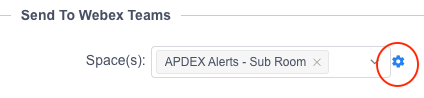
The typical use case is to send alerts to a Webex Teams Space – Usually 'APDEX Alerts' or the 'APDEX Alerts - Sub Room' for alerts that are still being tested. Other spaces can be added by clicking on the gear icon and putting in the Room ID.
You can also configure the alert to mention an individual or the on-call person for a team.
Step 2 – APDEX Alerting Criteria 
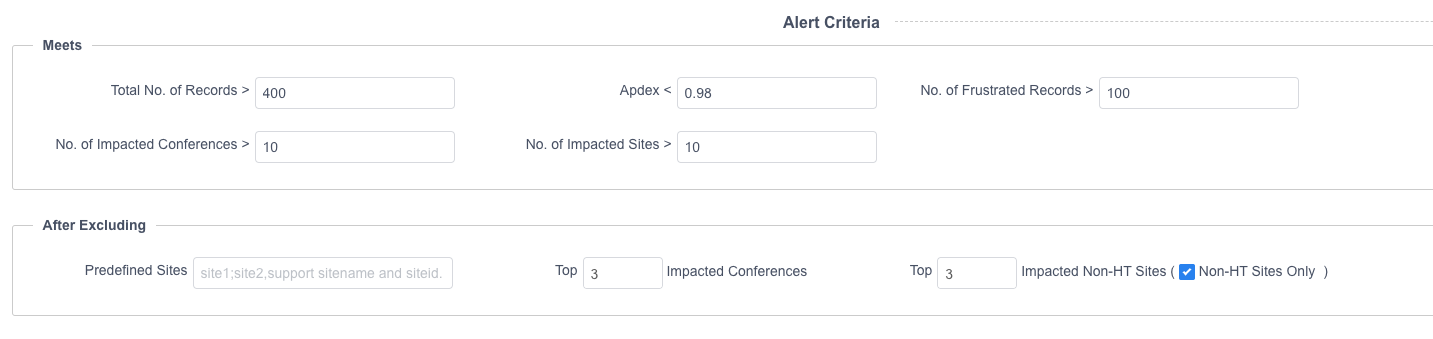
The essential APDEX alert criteria defines a score threshold along with the minimum number of total records, frustrated records, or impacted conferences or sites (if applicable).
Step 3 – Review and Save your Alert 
The last page just summarizes the information you entered before and then you can save your alert.
Back on the main Apdex Definitions and Alert Criteria page you should see your alert definition and can edit it again if needed.
Impact Analysis and Root Cause Analysis 
After an alert is triggered the notification will include links to the Impact Analysis and Root Cause Analysis reports.
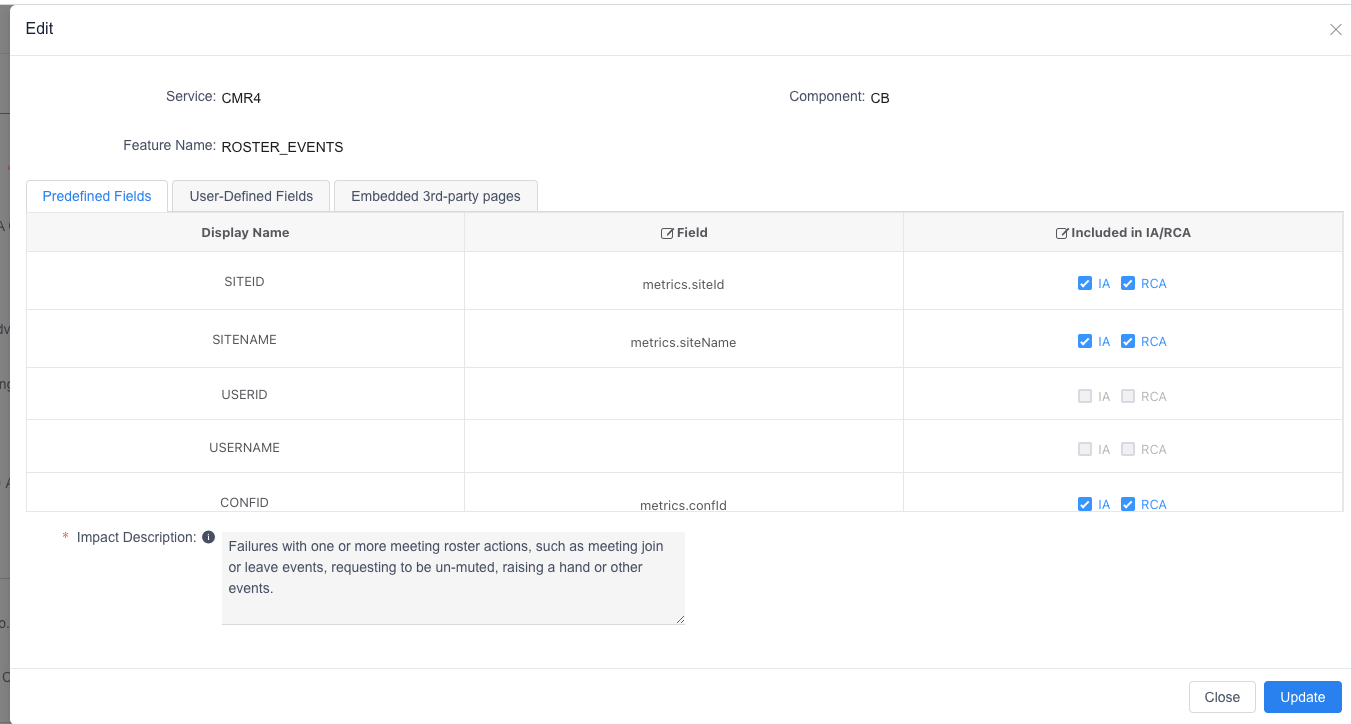
Both of these reports will use the logging fields from OpenSearch (generally CLP) that are specified in the Alert Definition. You can set these as appropriate and not every field will be applicable for every APDEX feature.
Predefined Fields
- Site ID
- Site Name
- User ID
- Username
- ConfID
- MeetingNumber
- GuestUserID
- PoolName
- Host
- FailReason
- ClientIP
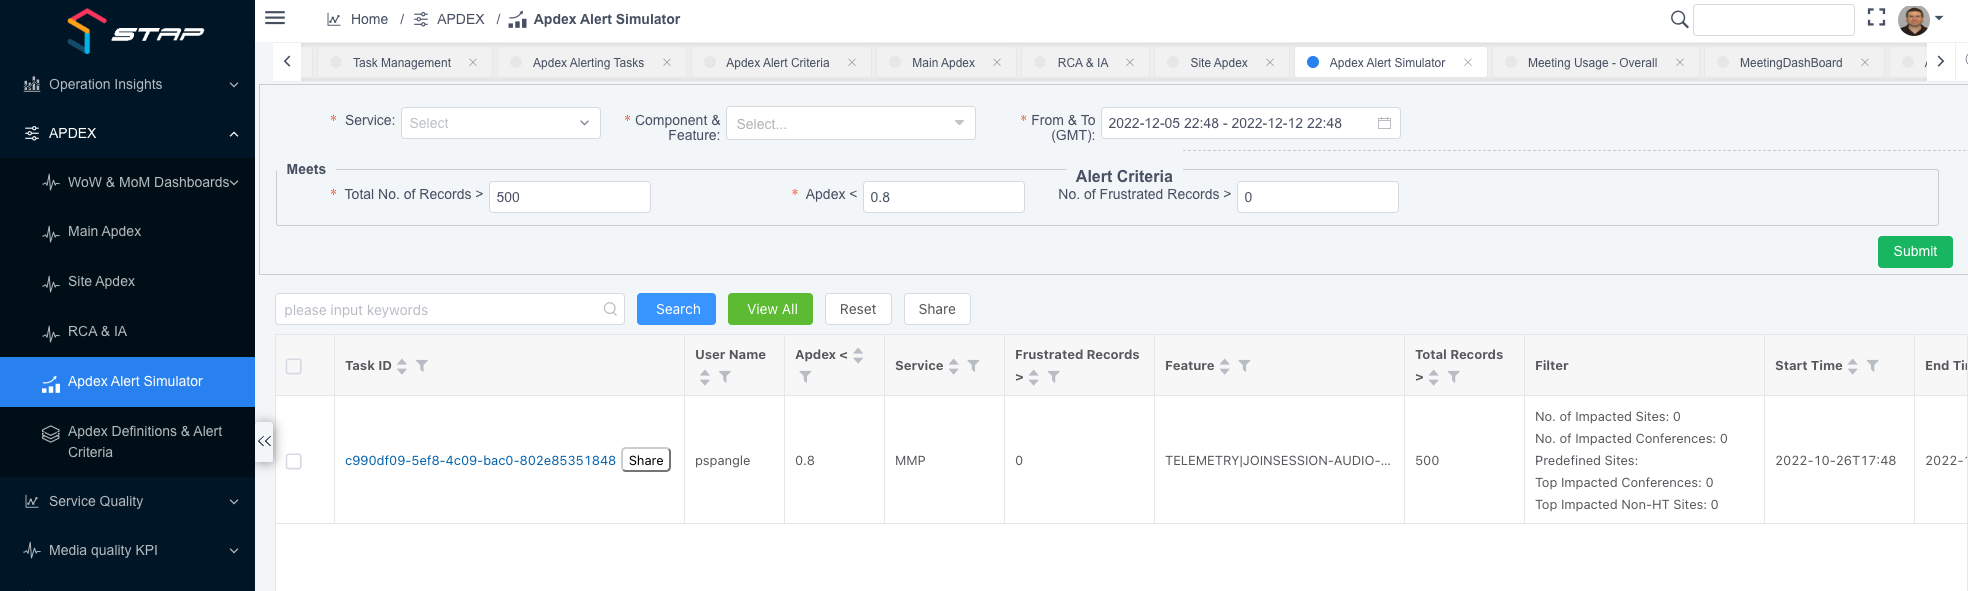
APDEX Alert Simulator 
There is also a tool that you may find useful to test out alerting criteria. You can find the Alert Simulator in the same menu right above the Apdex Definitions menu option.
The simulator allows you to pick your service, component, and feature and then try out criteria. Submitting your criteria creates a one-time job and then stores the results so that you can come back to inspect that and share the result with others.
How do I .... ? 
A. Add a new Webex Teams Space to send alerts to?
In the first section where you can select a space to send alerts to there is a gear icon next to the drop-down menu. If you click on that a new dialog box will open where you can add a new team space.
Clicking on 'Add' inserts a new row in the table and you just put in the name of the room and the Room ID.

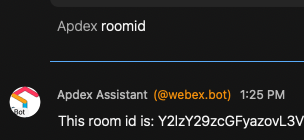
| How do you get the Room ID?
Add the Apdex Assistant to your room and then you can have the bot give you the id by typing '@Apdex room id'
B. How do I add in my team's PagerDuty for alerting?
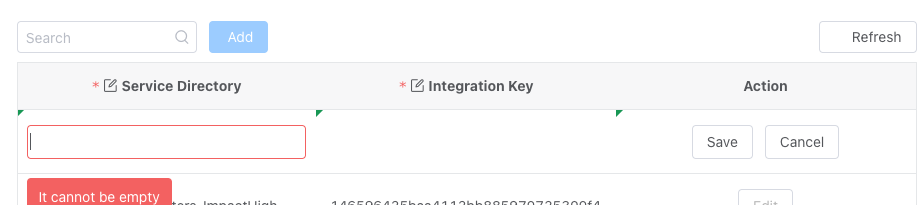
Similar to adding a new teams room there is a gear icon next to the PagerDuty field.
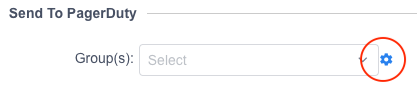
In the case of PagerDuty you need to find the Integration Key. Note that currently STAP supports the PagerDuty V1 Events API <https://developer.pagerduty.com/docs/ZG9jOjExMDI5NTc3-events-api-v1>_ to issue pagerduty alerts.
C. How do I have the alert go to whoever is on call in our team?
You can have the on-call individual mentioned by getting the Escalation Policy ID
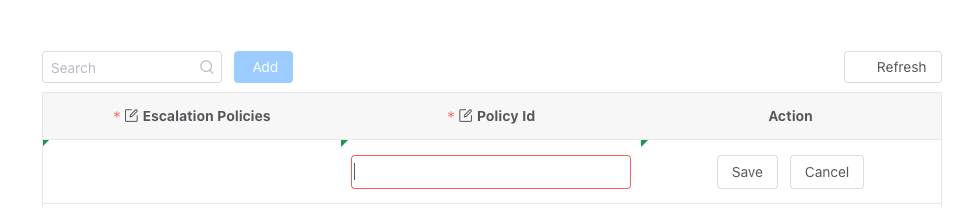
Within PagerDuty you can find your escalation policy id by going to People → Escalation Policies and then viewing the escalation policy – the id will be at the end of the url and will look something like...
https://ciscospark.pagerduty.com/escalation_policies#PABCDEF
The ID is probably 7 characters long and that is what you want to put into the policy id field.
D. Where do I go to set up Alerts for FedRAMP services?
For services running within FedRAMP you would go to the url within the boundary: https://stap2.webex.com/front
Note that to access STAP2 you will need FedRAMP access and need to submit an Account Provisioning request for access to STAP2.
The APDEX Alert creation interface is otherwise the same as Commercial STAP/Front.