Where can you find Apdex Data 
Apdex Dashboard For Commercial Environment: 
Apdex data will show how a service is performing and for us to visualize the performance data of a service. We use Grafana as our data visualization tool.
The apdex main dashboard can be found at the following link: https://metrics.o.webex.com/d/ea8c8555-9af9-4999-a811-a5793e554792/main-apdex and filter Environment=COMMERCIAL.
Our apdex dashboard offers many ways to filter visualized data. Some of these filters include filtering by: service, component, feature, shard, incident priority, incident number, data center, change number, and change type.
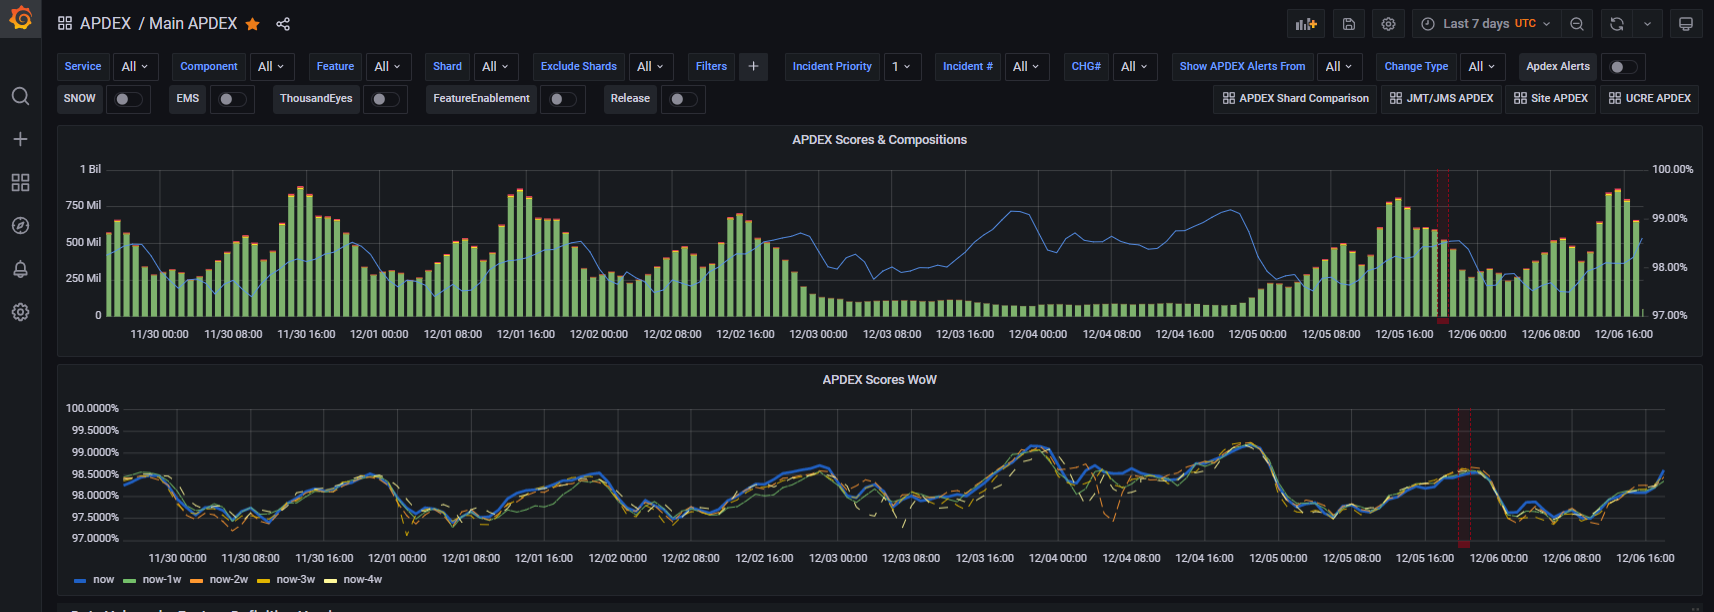
Filter By Data Center: 
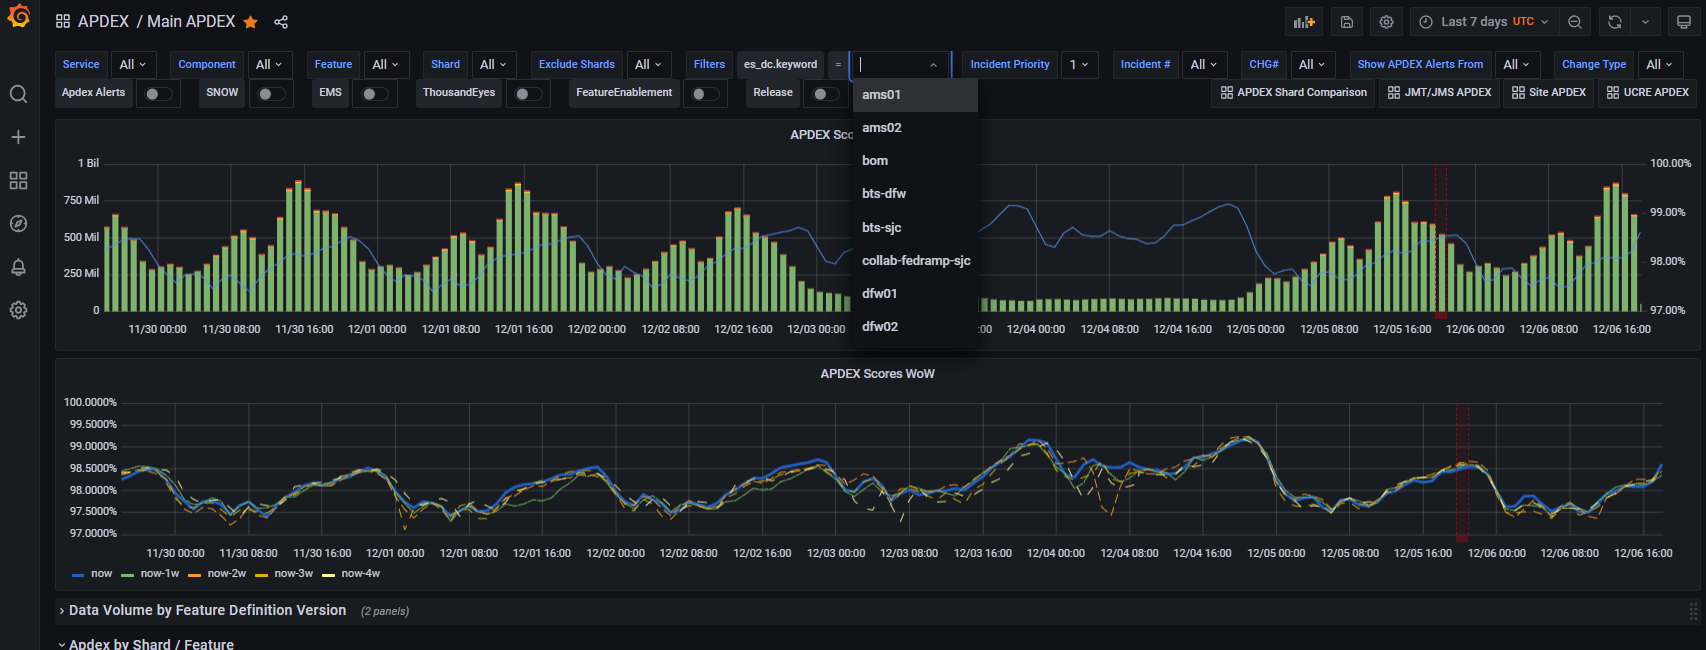
To filter by data center simply click the '+' next to the filter label and type "es_dc.keyword" in the text box. From there another text box should appear listing all the data center's to filter from.
Annotations: 
The apdex dashboard provides annotations, which can be enabled(via the toggle buttons on the main menu bar) to show some information about an impacted apdex score in the given time range. Some of these annotations include:
- Apdex Alerts: When enabled it will show all apdex alerts that were sent to a Webex space room. You can filter by which Webex space in the "Show APDEX Alerts From" filter.
- SNOW: This annotation will display all change requests/services which may be a cause for an impacted apdex score.
- Event Management System(EMS): Will display all events recorded by EMS, this can include many internal monitoring services. It may be the cause of why an apdex score was impacted.
- Thousand Eyes: A more specific type of internal network monitoring, Thousand Eyes may have recorded an event that impacted apdex scores.
- Feature Enablement: This annotation will give us information on when a new feature was enabled or when a new version of a feature was enabled. A new version of a feature can impact apdex scores as well.
- Release: Used to see if a new release version impacted apdex scores.
Apdex Dashboard For FedRAMP Environment: 
We also offer an apdex dashboard similar to our commercial one for the FedRAMP environment.
You find the apdex FedRAMP dashboard at this link: https://metrics.o.webex.com/d/ea8c8555-9af9-4999-a811-a5793e554792/main-apdex and filter Environment=FEDRAMP.