Observability 
Where to watch EAP at runtime and what it emits — metrics, logs, traces, and alerting.
Metrics 
All EAP dashboards live in the EAP folder on Grafana.
Resource Metrics 
From the Kubed baseline instrumentation — CPU, memory, disk, etc.
Service Health Metrics 
EAP Health Metrics 
| Instrument | Prometheus name | Type | Labels | Meaning |
|---|---|---|---|---|
eap_health_component_up | eap_health_component_up | Gauge (0/1) | component | Whether a component is available: down→0, otherwise (ok/degraded/unknown)→1 |
eap_health_component_status | eap_health_component_status | Gauge (enum) | component | Numeric status: ok=1, degraded=0.5, down=0, unknown=-1 (for Grafana threshold coloring) |
eap_health_check_latency_ms | eap_health_check_latency_ms_milliseconds | Gauge (ms) | component | Latency of the component's last probe (ms); not reported when no latency data is available |
eap_health_overall_up | eap_health_overall_up | Gauge (0/1) | endpoint | Overall readiness: HTTP 200→1, otherwise 0 |
eap_health_requests_total | eap_health_requests_total | Counter | endpoint, http_status, status | Count of health-endpoint responses |
LLM Call Metrics 
| Instrument | Prometheus name | Type | Labels | Meaning |
|---|---|---|---|---|
eap_llm_requests | eap_llm_requests_total | Counter | method, path, http_status, status_class, outcome | LLM Request Count |
eap_llm_request_duration | eap_llm_request_duration_milliseconds_bucket / _sum / _count | Histogram (ms) | method, path, http_status, status_class, outcome | Request Duration (until the upstream response headers are received) |
Codex & OpenCode Metrics 
Emitted by the Codex and OpenCode OTel exporters.
Convention — histogram instruments expose three Prometheus series each (
_bucket,_count,_sum), written below as_{bucket,count,sum}.
OpenCode Metrics 
opencode_cache_count_total
opencode_cost_usage_USD_total
opencode_message_count_total
opencode_model_usage_total
opencode_retry_count_total
opencode_session_count_total
opencode_session_cost_total_USD_{bucket,count,sum}
opencode_session_duration_milliseconds_{bucket,count,sum}
opencode_session_token_total_tokens_{bucket,count,sum}
opencode_token_usage_tokens_total
opencode_tool_duration_milliseconds_{bucket,count,sum}
Codex Metrics 
codex_api_request_duration_ms_milliseconds_{bucket,count,sum}
codex_api_request_total
codex_plugins_startup_sync_final_total
codex_plugins_startup_sync_total
codex_process_start_total
codex_remote_models_load_cache_duration_ms_milliseconds_{bucket,count,sum}
codex_shell_snapshot_duration_ms_milliseconds_{bucket,count,sum}
codex_shell_snapshot_total
codex_sqlite_init_count_total
codex_sqlite_init_duration_ms_milliseconds_{bucket,count,sum}
codex_sse_event_duration_ms_milliseconds_{bucket,count,sum}
codex_startup_phase_duration_ms_milliseconds_{bucket,count,sum}
codex_thread_skills_description_truncated_chars_{bucket,count,sum}
codex_thread_skills_enabled_total_{bucket,count,sum}
codex_thread_skills_kept_total_{bucket,count,sum}
codex_thread_skills_truncated_{bucket,count,sum}
codex_thread_started_total
codex_tool_call_duration_ms_milliseconds_{bucket,count,sum}
codex_tool_call_total
codex_tool_unified_exec_total
codex_turn_e2e_duration_ms_milliseconds_{bucket,count,sum}
codex_turn_memory_total
codex_turn_network_proxy_total
codex_turn_token_usage_{bucket,count,sum}
codex_turn_tool_call_{bucket,count,sum}
codex_turn_ttfm_duration_ms_milliseconds_{bucket,count,sum}
codex_turn_ttft_duration_ms_milliseconds_{bucket,count,sum}
Alerting 
EAP gateway alerts: alerting list (service=eap-gateway).
The alert rules are defined in eap-k8s-alert-rules.json and eap-health-status-alert-rules.json. Grafana evaluates both rule groups every 60 seconds. All rules use service=eap-gateway, link to the eap-health-status dashboard, treat a Grafana no-data result as OK, and report rule evaluation errors as Error. Missing telemetry is detected by the explicit health-metrics-missing rules.
Kubernetes Resource Alerts 
These rules cover the enterprise-agent-platform (prod) and enterprise-agent-platform-stage namespaces. They retain the cluster, namespace, and affected Kubernetes resource labels so notifications identify the exact container or PVC.
| Alert | Severity | What it covers | When it triggers |
|---|---|---|---|
EAPK8sMemoryHigh | Warning | Container memory working set compared with its configured memory limit, grouped by cluster, namespace, pod, and container. | Memory usage remains above 85% of the limit for 10 minutes. |
EAPK8sMemoryCritical | Critical | The same per-container memory coverage as the warning rule, at the critical threshold. | Memory usage remains above 95% of the limit for 5 minutes. |
EAPK8sPVCUsageHigh | Warning | Used capacity compared with total capacity for each PVC, grouped by cluster, namespace, and persistent volume claim. | PVC usage remains above 80% for 10 minutes. |
EAPK8sPVCUsageCritical | Critical | The same per-PVC storage coverage as the warning rule, at the critical threshold. | PVC usage remains above 90% for 5 minutes. |
Health Status and LLM Alerts 
Unless a row names a specific environment, these rules cover all eap-gateway metric series available to the alert datasource and retain labels such as cluster, namespace, pod, component, endpoint, method, or path for diagnosis.
| Alert | Severity | What it covers | When it triggers |
|---|---|---|---|
EAPHealthMetricsMissingStage | Critical | The stage gateway health-metric export path, including the gateway, OTel collector, Prometheus scrape, and metric export pipeline. | No eap_health_overall_up sample is received from enterprise-agent-platform-stage for 10 minutes; the rule fires immediately after that lookback becomes empty. |
EAPHealthMetricsMissingProd | Critical | The prod gateway health-metric export path, including the gateway, OTel collector, Prometheus scrape, and metric export pipeline. | No eap_health_overall_up sample is received from enterprise-agent-platform for 10 minutes; the rule fires immediately after that lookback becomes empty. |
EAPOverallReadinessDown | Critical | Overall readiness for each gateway health endpoint, grouped by cluster, namespace, service, and exported endpoint. | The five-minute lookback contains an eap_health_overall_up value below 1 and the condition remains active for 2 minutes. |
EAPCriticalDependencyDown | Critical | Critical database and NFS dependencies for each gateway pod. | The five-minute lookback contains eap_health_component_up=0 for database or nfs and the condition remains active for 2 minutes. |
EAPComponentDown | Warning | Non-critical health components other than database and NFS, evaluated per pod. | The ten-minute lookback contains a component status score of 0 (down) and the condition remains active for 5 minutes. |
EAPComponentDegradedOrUnknown | Warning | Non-critical health components reporting degraded (0.5) or unknown (-1); fully down components are handled by EAPComponentDown. | The minimum component status in the ten-minute lookback is below 1 but not 0, and the condition remains active for 10 minutes. |
EAPHealth503Responses | Warning | HTTP 503 responses from each exported gateway health endpoint. | At least one 503 response occurs in the five-minute lookback and the condition remains active for 1 minute. |
EAPHealthCheckLatencyHigh | Warning | Average probe latency for each health component and gateway pod. | Five-minute average health-check latency exceeds 5,000 ms and remains above the threshold for 5 minutes. |
EAPLLMProxyTransportErrors | Critical | LLM proxy transport and connectivity failures, grouped by method, path, and HTTP status. | At least one request with outcome="proxy_error" occurs in the five-minute lookback and the condition remains active for 1 minute. |
EAPLLMUpstreamErrorRateHigh | Warning | LLM upstream response failures for each gateway path. | The five-minute upstream-error rate exceeds 5%, at least 20 requests occurred in that window, and the condition remains active for 5 minutes. |
EAPLLMLatencyP95High | Warning | LLM proxy p95 time to receive upstream response headers, grouped by method and path. | The five-minute p95 latency exceeds 30,000 ms, at least 20 duration samples occurred in that window, and the condition remains active for 10 minutes. |
EAPLLMDurationSamplesMissing | Warning | Consistency between the LLM request counter and duration histogram instrumentation for each method and path. | Requests increase during the ten-minute lookback but duration sample counts do not, and the mismatch remains active for 5 minutes. |
Logs 
| Field | Value |
|---|---|
| Portal | log.o.webex.com |
| Index | wxm-app:logs* |
| Filter example | k8s.namespace is enterprise-agent-platform-stage, datacenter is wdfwgen-p-5 |
Traces 
OpenSearch 
Portal: OpenSearch Portal.
| Environment | Logs index | Traces index |
|---|---|---|
| stage | ss4o_logs-logs-dev_ai_studio_otel | ss4o_traces-traces-dev_ai_studio_otel |
| prod | ss4o_logs-logs-eap_otel | ss4o_traces-traces-eap_otel |
Tempo + Grafana (LMA) 
| Environment | Endpoint | Username | Grafana |
|---|---|---|---|
| stage | https://tempo-scratch.us-vaameti1.e30.prod.infra.webex.com/v1/traces | french_river | Explore |
| prod | TBD | TBD | TBD |
How to Find Traces 
LMA Sample 
Step 1 — Get the Conversation ID 
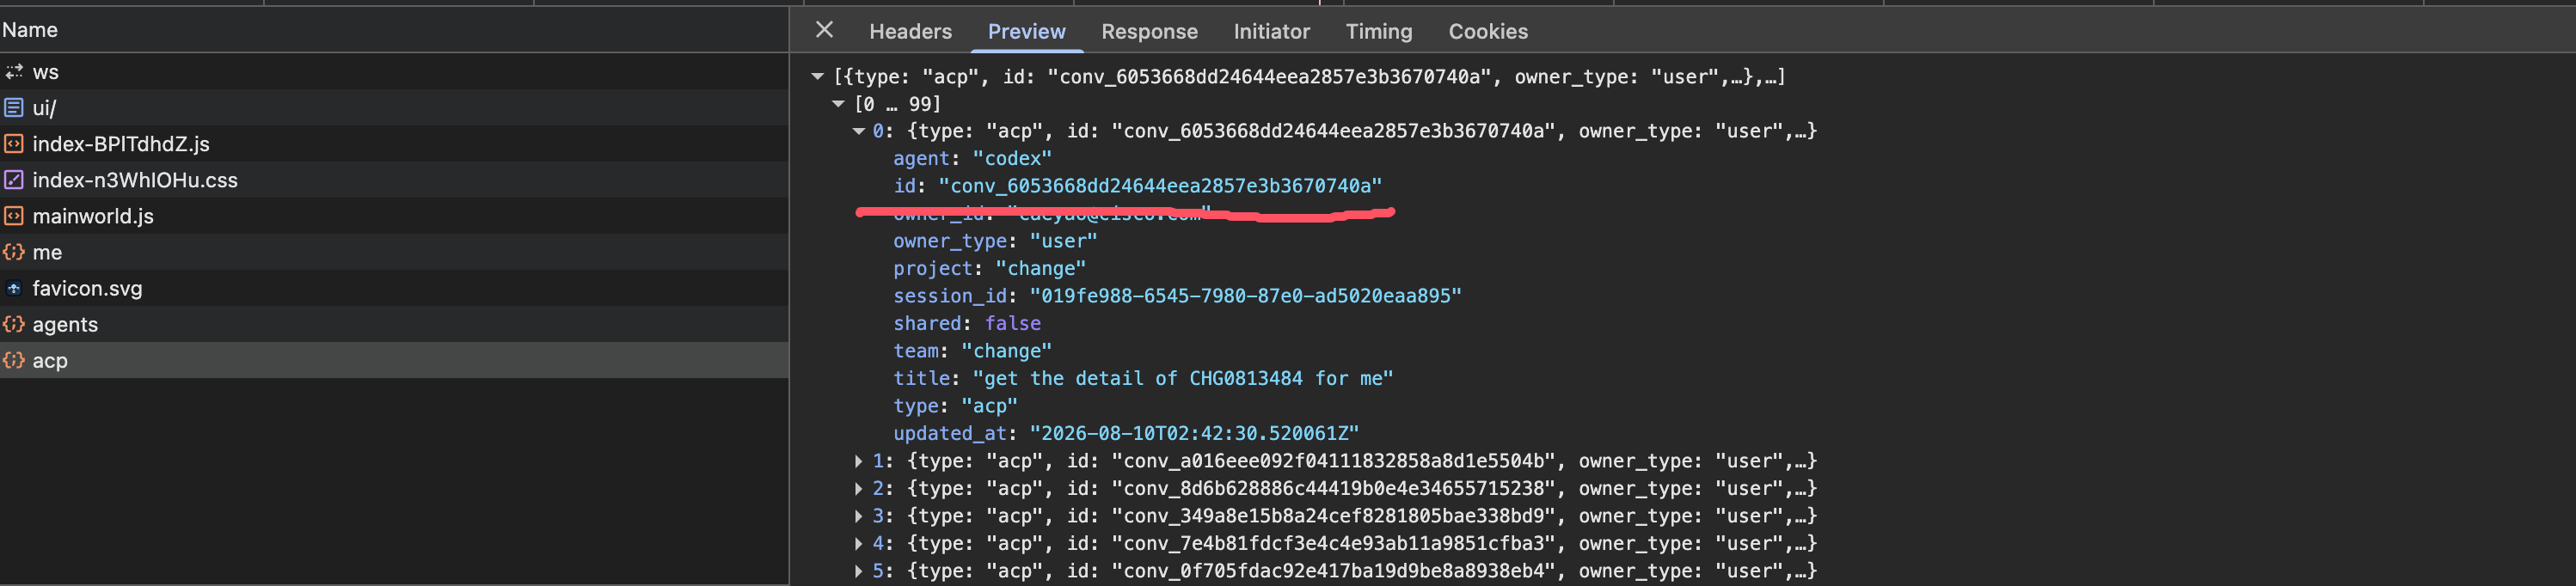
Every trace is keyed by a conversation_id. The easiest way to obtain it is directly from the EAP page:
- Open your browser's developer console.
- Refresh the page and select the
ACPrequest (see the image below). - Copy the
conversation_idfrom the conversation you want to track.
Step 2 — Search for the Trace in Grafana 
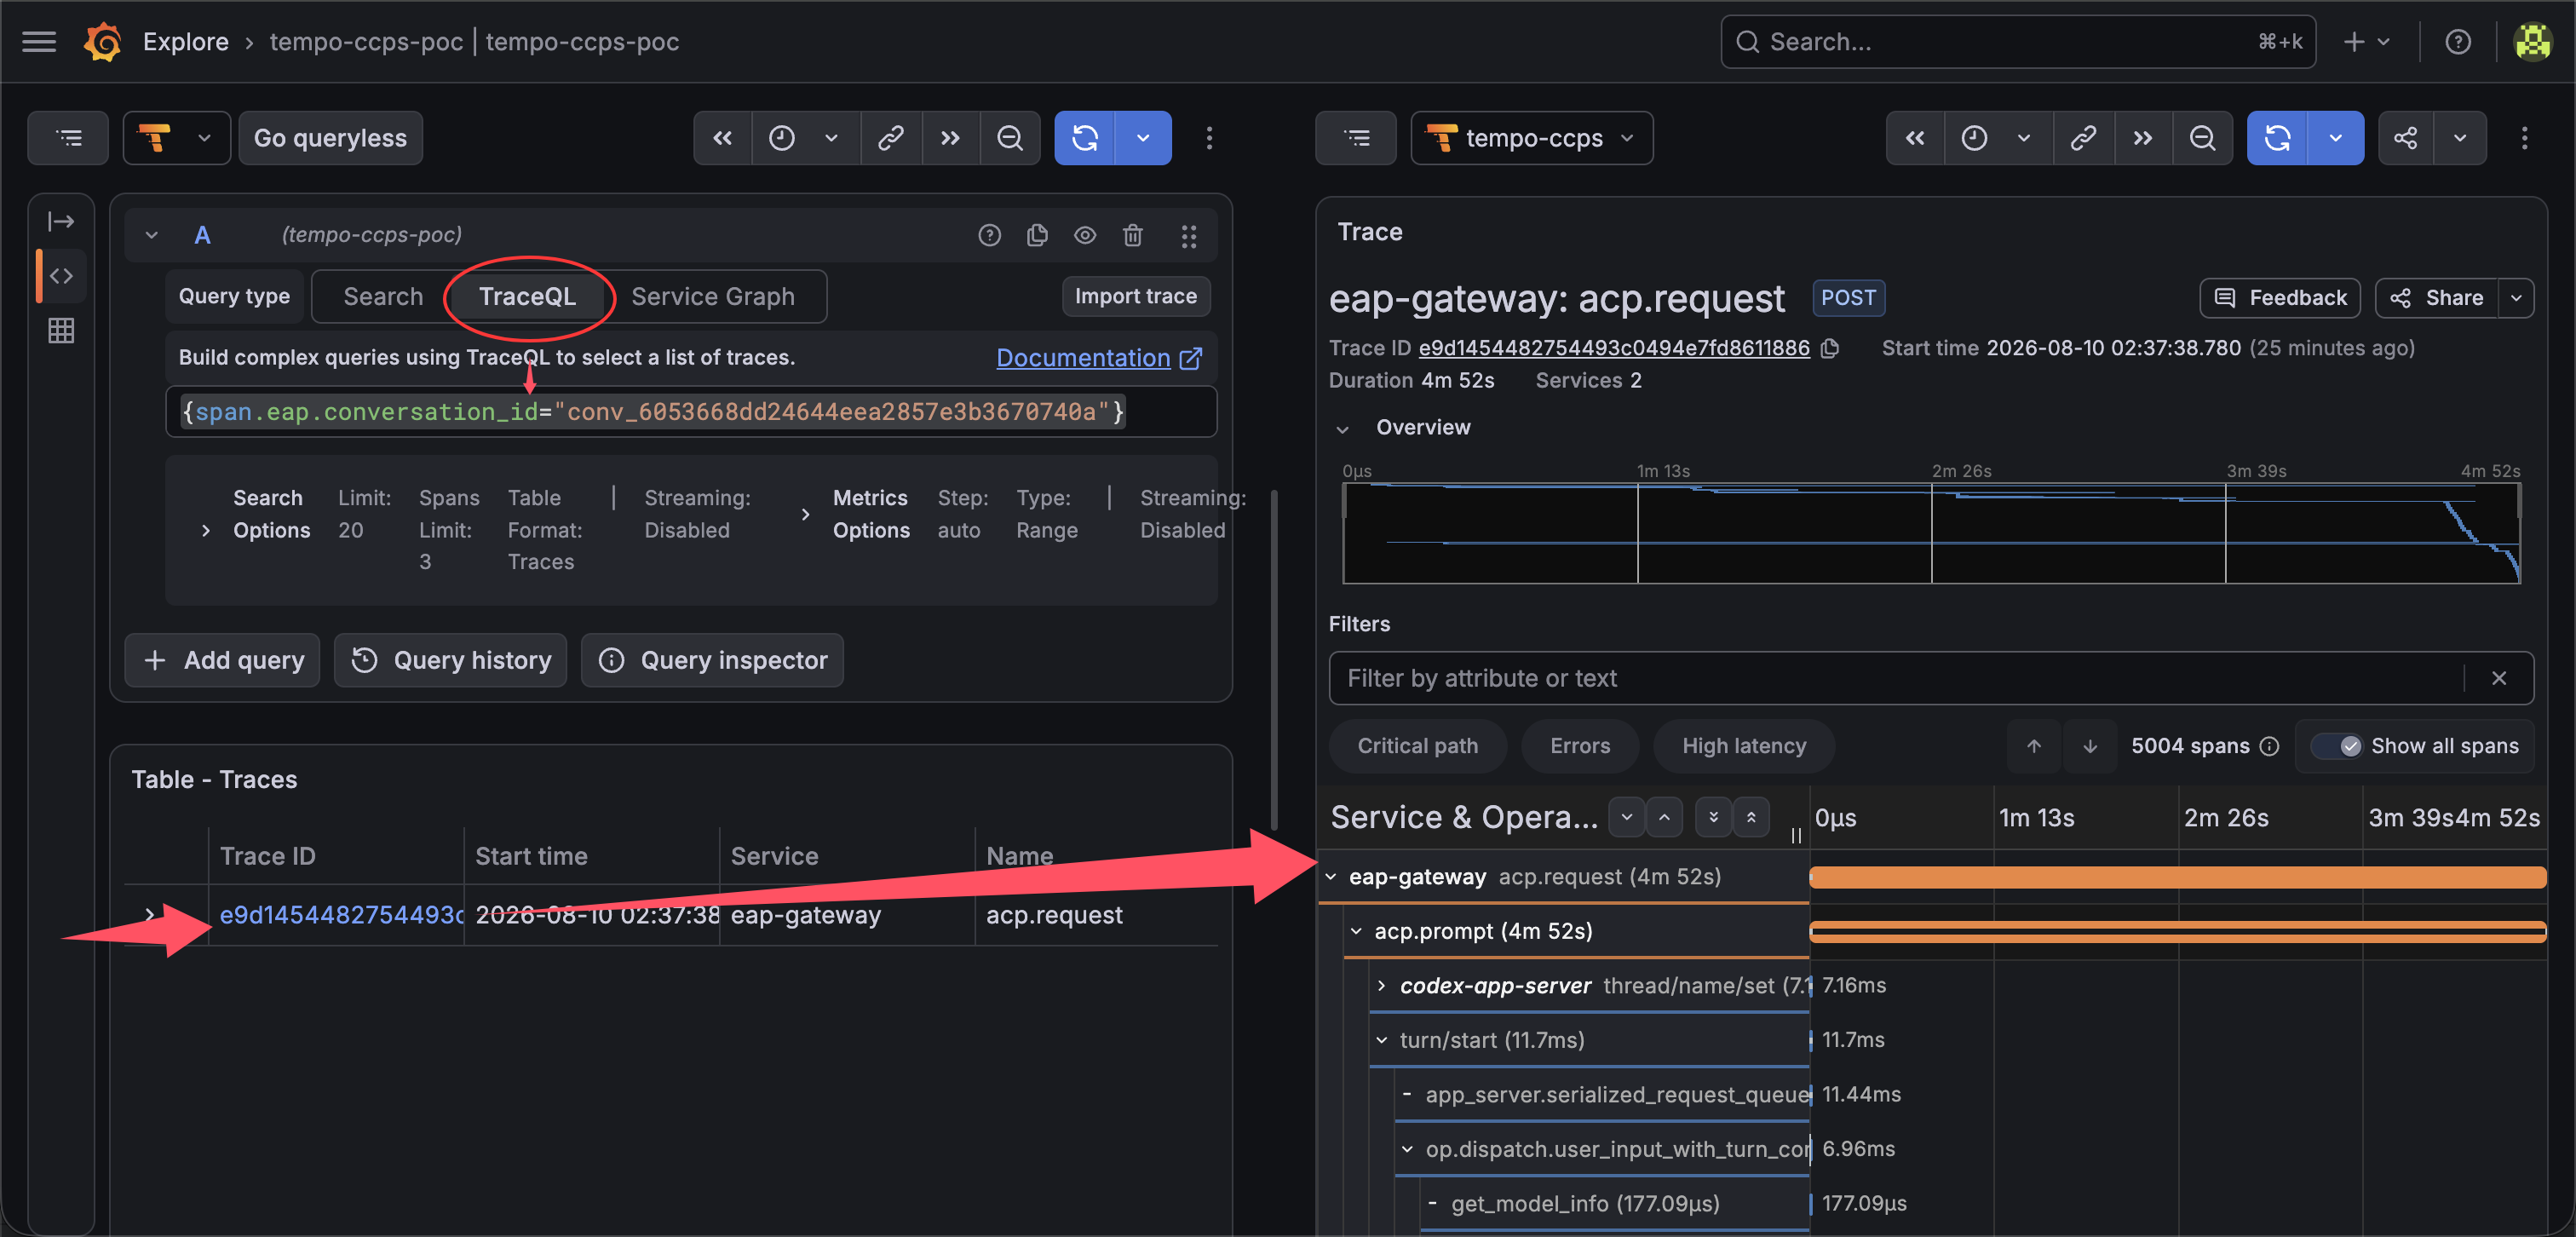
- Open Grafana and go to the Explore page.
- Select the
tempo-ccps-pocdatasource. -
Query by the
conversation_idyou copied, for example:{span.eap.conversation_id="conv_6053668dd24644eea2857e3b3670740a"} -
Click the matching trace to inspect its details.
Step 3 — Inspect an MCP Tool Call 
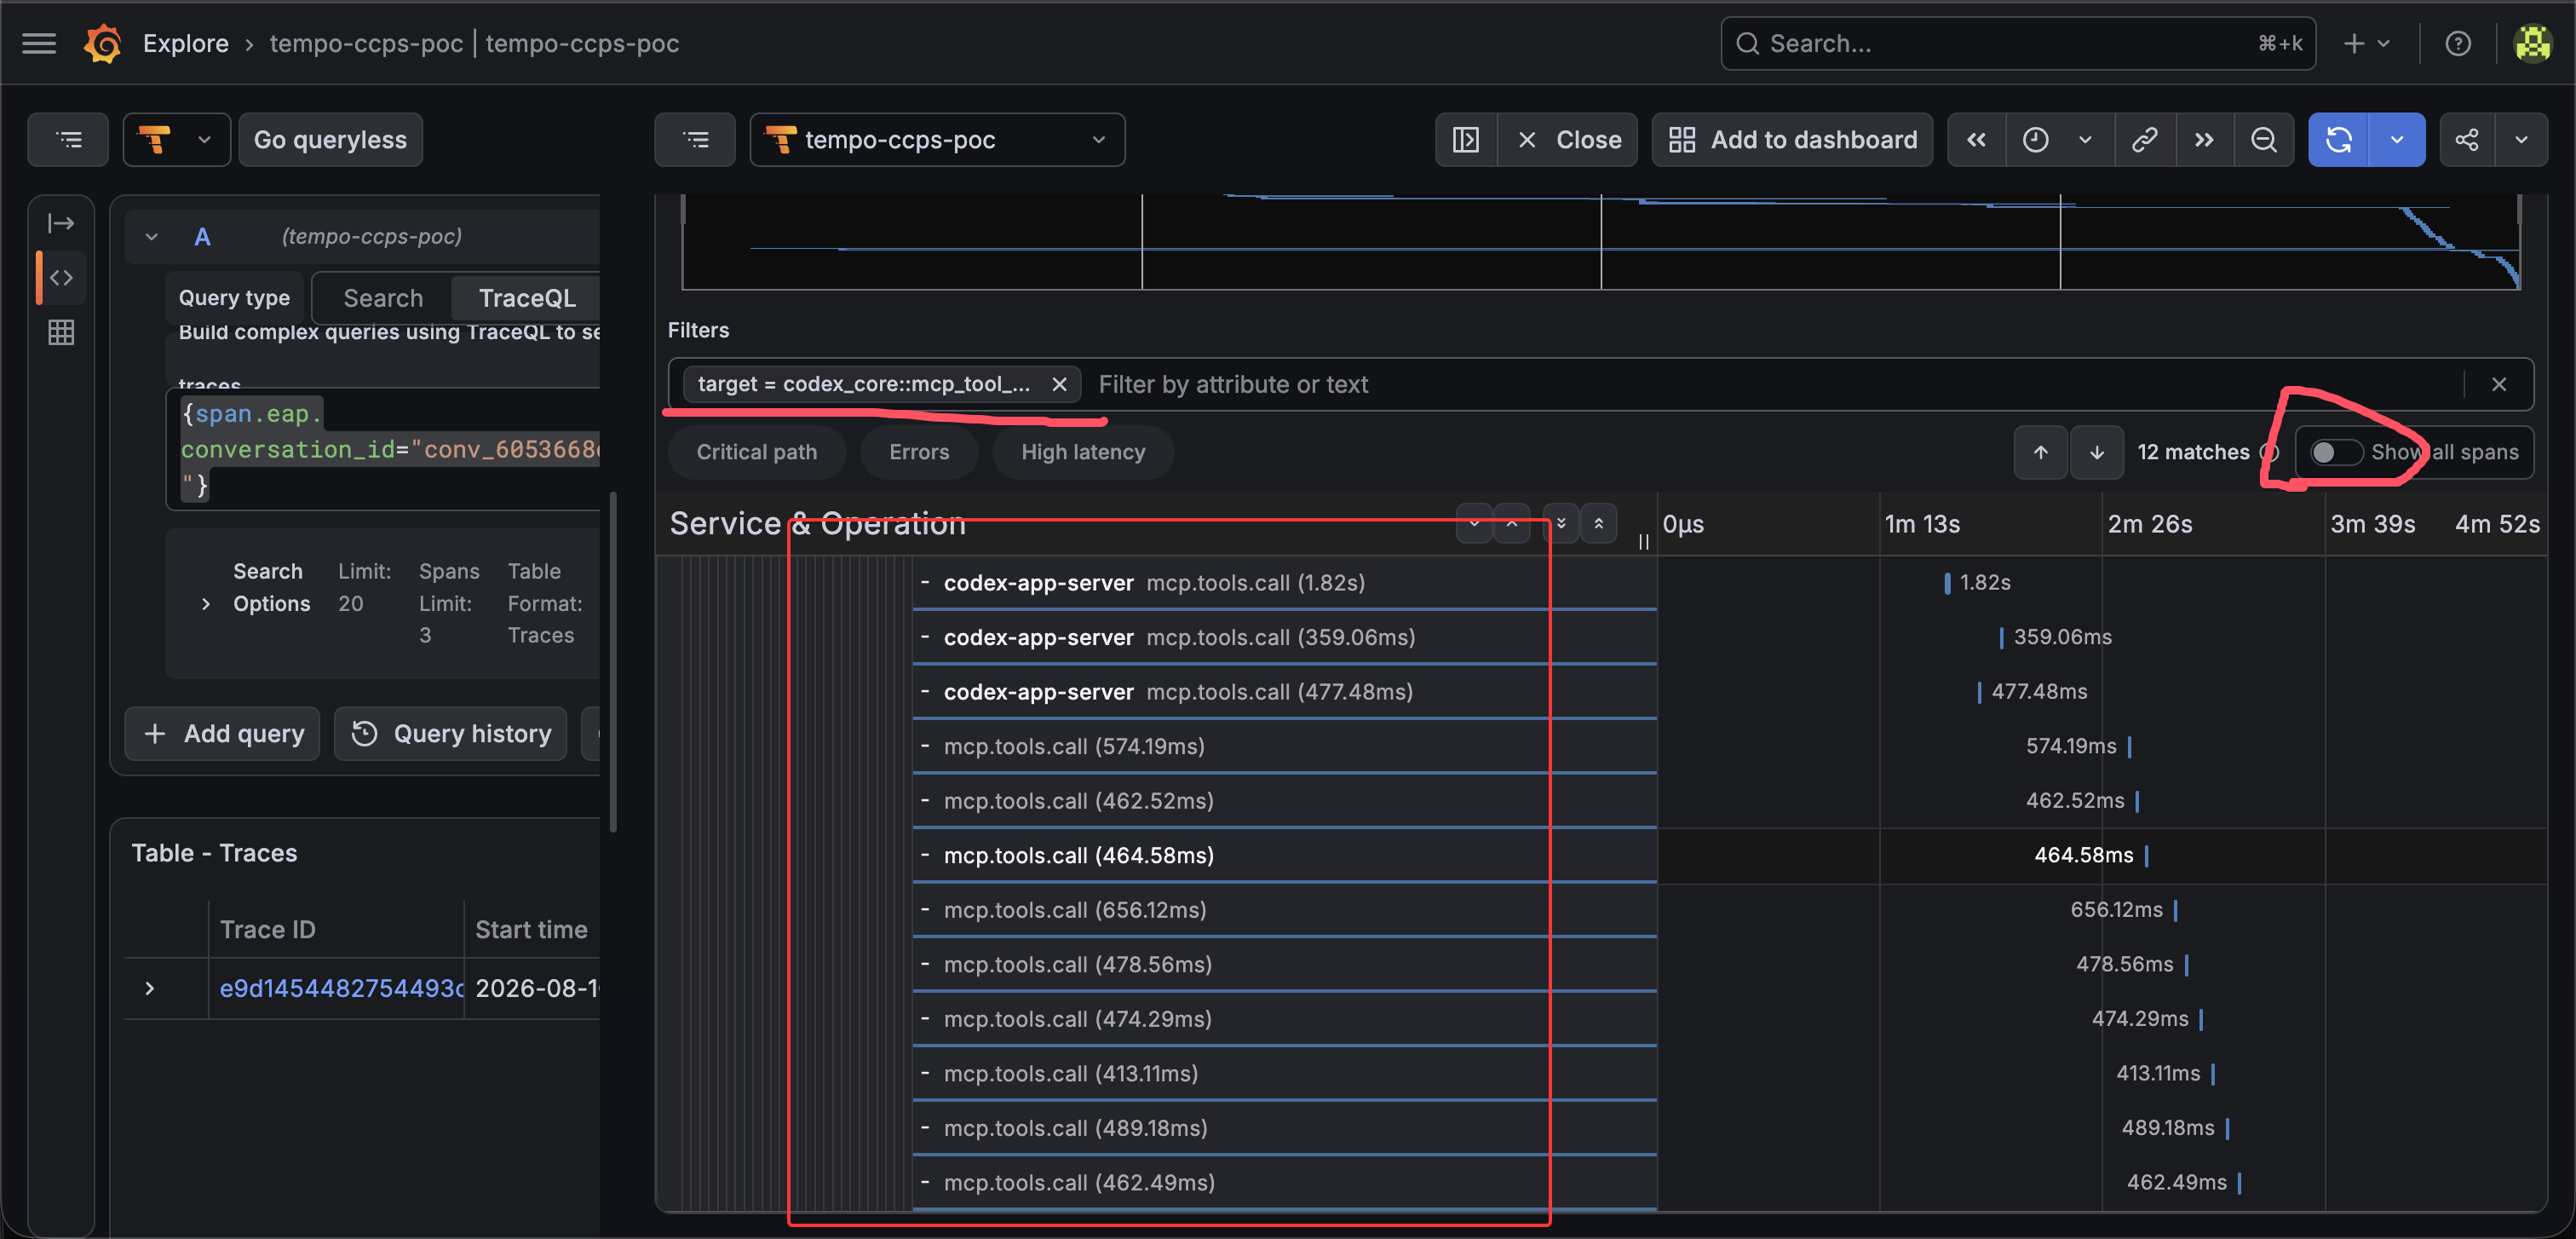
To isolate an MCP tool call within a trace, filter by an attribute such as target = codex_core::mcp_tool_call and turn off the Show all spans switch. The tool calls then stand out clearly.
What Conversation Issues Can Be Diagnosed? 
- End-to-end tracing across systems — Using
eap.conversation_idorcodex.thread_id, you can follow the full timeline of a single conversation in one trace—from the gateway receiving the prompt, to forwarding it to Codex, through Codex's internal processing—without manually stitching IDs together from logs. - Latency and timeout root cause — Compare the duration of the
acp.promptspan with its child Codex spans to tell whether the bottleneck is on the gateway side (e.g., authentication, binding/reconnection) or inside the Codex runtime. - Failing conversation turn — Because each prompt turn maps to a span, the
conversation_idpinpoints the user and the exact interaction that failed, while child spans locate the point of failure within Codex. - Reconnection and binding anomalies — Events from the
replace_bindingreconnection logic within a prompt appear directly in the span timeline.