Cluster Build Post Validation
Post Validation for Kubed Cluster Build aims to verify the health status of core platform components in a new or rebuilt cluster. Core platform components list is following the definition in Backstage under WebexKubed Platform domain.
Based on the core platform components list, MAS team figures out the validation indicators co-working with cluster build team. Validation indicators help to track the realtime health status and can be monitored on a dedicated dashboard.
More design detail for this feature refer to RFC doc
Validation Indicators 
| Kubed Core Components | Validation | Indicators | Monitoring Tool |
|---|---|---|---|
| Kubernetes Cluster | 1. K8S cluster control plane health 2. Nginx Ingress pool health | 1. MCT URLWatch Monitor 2. MCT ESCount Monitor | MCT |
| Infrastructure | 1. Worker nodes health 2. OCP node anti-affinity conflict | 1. Prometheus node problem detector 2. OCP affinity metrics ocp_anti_affinity_conflict | LMA Grafana (Mimir-Platform) |
| Streaming | 1. SLI - Availability of Kafka Brokers 2. SLI - Availability of Kafka Mirror | 1. Cluster built-in Prometheus metrics for Kafka brokers 2. Cluster built-in Prometheus metrics for Kafka mirror | LMA Grafana (Mimir-Platform) |
| Certificate Management | 1. SLI - Availability of Cert manager 2. Expiration of Cert issued by Cert manager 3. Expiration of Cert on K8S node | 1. Cluster built-in Prometheus metrics for Cert manager 2. Prometheus metrics exposed by Cert manager 3. Prometheus metrics exposed by Kubeadm | LMA Grafana (Mimir-Platform) |
| Monitoring Stack | 1. Chart version check based on Element release 2. SLI - Availability of app/platform Prometheus 3. SLI - Availability of other monitoring components | 1. Helm Prometheus exporter 2. Cluster built-in Prometheus metrics for app/platform Prometheus 3. Cluster built-in Prometheus metrics for other monitoring components | LMA Grafana (Mimir-Platform) |
| Cluster DNS | 1. SLI - Availability of CoreDNS 2. SLI- Availability of ExternalDNS | 1. Cluster built-in Prometheus metrics for CoreDNS 2. Cluster built-in Prometheus metrics for ExternalDNS | LMA Grafana (Mimir-Platform) |
| Platform Components Deployment | 1. Deployment mismatch replicas 2. StatefulSet mismatch replicas 3. DaemonSet not scheduled number | 1. 2. 3. Cluster built-in Prometheus metrics (kube-state-metrics) | LMA Grafana (Mimir-Platform) |
| Cluster Security Tooling | 1. Node OS-Bundle version | 1. Prometheus metrics exposed by Infra-service | LMA Grafana (Mimir-Platform) |
Post Validation Grafana Dashboard 
All validation indicators are presented in a Grafana dashboard. Cluster build team is monitoring the dashboard during setup or rebuild a cluster.
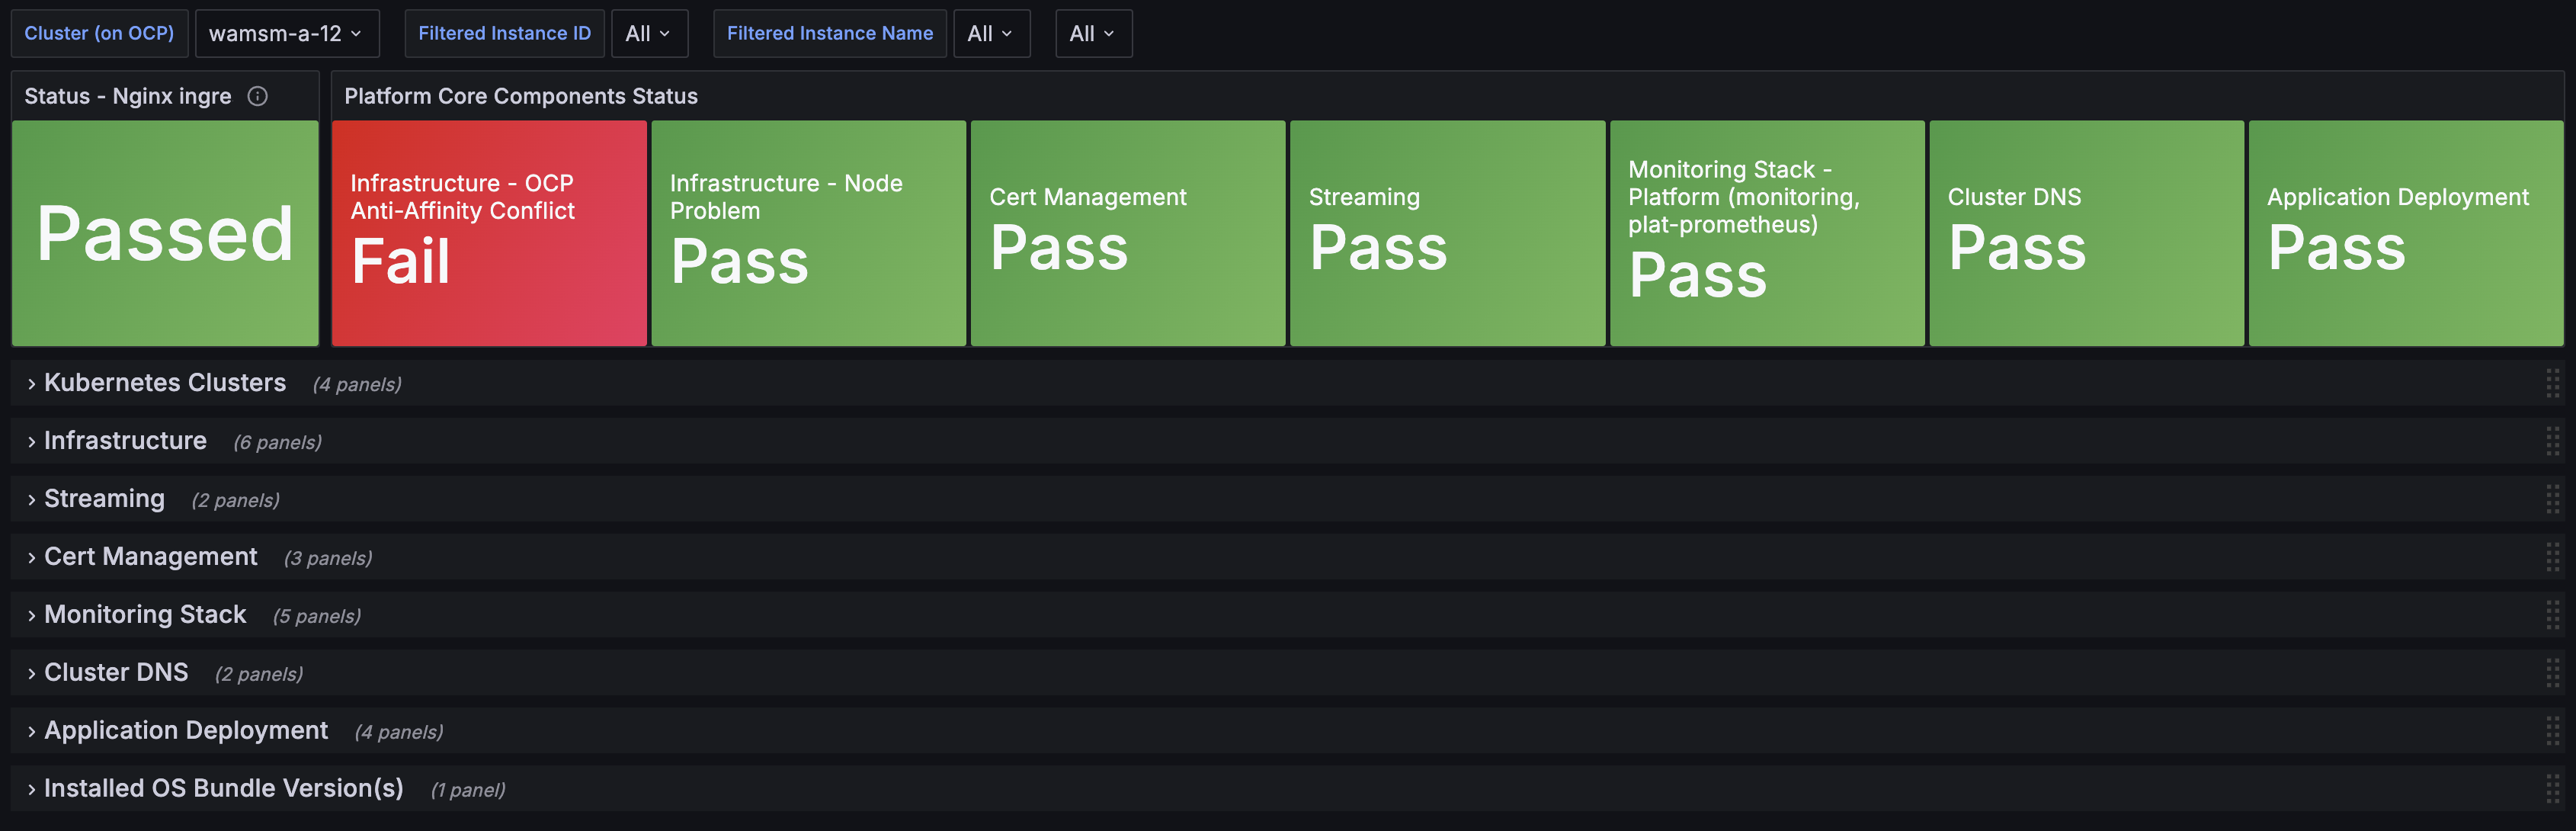
More detail please refer to the dashboard