RFC 07: WebexKubed SLA Synthetic Heart based Solution 
Author(s): George He(jinjhe), Jimmy Zhou(shengz) 
1. Overview 
This RFC is to provide a solution for WebexKubed Platform SLA report.
It will define what data is necessary for SLA, how to get those data and the algorithm of total SLA report for platform.
This proposal also provide a centralized management solution of Synthetic Heart test task dispatch to meet the easy-config and apply cross region/cluster test requirement.
2. Background & Motivation 
WebexKubed has 200+ kubernetes cluster in production now. And also, there are lots of other services in Kubed onboard pending list, so the overall Kubed platform may scale up 4x. For customers, currently hard to know the availability agreements made by platform team. They are not easy to check the kubernetes cluster and platform health status meeting the agreements.
It's necessary to figure out the definition of SLA(Service Level Agreement) and design approaches to collect SLI(Service Level Indicator). Defined 3 types of SLI: - K8S Cluster Availability - Platform Critical Service Availability - Endpoints Availability
Currently, we have Synthetic Heart for in-cluster and self monitoring, and it takes the test result as metrics going to central storage Thanos in observability cluster.
Here we got 3 pain points during we think about SLA requirement: 1. Currently Synthetic Heart test plugin may not able to cover all the requirements of SLI data. 2. SLI data requires to be collected from outside of target cluster. For now, Synthetic Heart is deployed in-cluster and its test targets are also mainly in-cluster. If we manually add CRD of cross cluster tests, is takes huge efforts and is not easy to update and maintain. 3. The test is serial now and need capability to test in parallel to be more realtime. For example, Now External Cluster Health Check takes 4-min for 200 clusters. It will be more than 20-min if count of cluster up to 1000
To solve #2, #3, we proposed a solution about distributed workers + central lightweight dispatcher
And central dispatcher is compatible with the Archipelago Business Monitoring Solution (MAS - Monitoring and Alerting Service).
3. Proposed Solution 
3.1 Definitions and Measurement of SLI 
SLI indicate the proportion of services is accessible for customers. SLA isn't met will affect the access of the service from end-user. From end-user perspective, SLI data is completely collected from outside of target cluster and aggregated in a central place.
3.1.1 K8S Cluster Availability 
This measures the percentage of time that your K8s clusters are available and operational.
AWS EKS: “Monthly Uptime Percentage” for a given EKS Cluster is calculated by subtracting from 100% the percentage of 5-minute intervals during the monthly billing cycle in which the EKS Cluster endpoint was Unavailable. If you have been running that EKS Cluster for only part of the month, your EKS Cluster is assumed to be 100% available for the portion of the month that it was not running. Monthly Uptime Percentage measurements exclude Unavailability resulting directly or indirectly from any Amazon EKS SLA Exclusion.
Azure Kubernetes Services (AKS): financially backed SLA guarantees an uptime of 99.95 percent for the Kubernetes API server for clusters that use Azure Availability Zones and 99.9 percent for clusters that don’t use Availability Zones.
Cluster Availability Percentage (%) =(Max Available Min - Down Time Min)/ Max Available Min X 100
Max Available Min: during bill cycle(usually a month), maximum minutes of cluster operational time
DownTime Min: minutes of Kubernetes cluster API server was unavailable
Measure and Calculate SLI K8S Cluster Availability
Follow the EKS and AKS measurement approach, will test Kubernetes API health endpoints to collect the status of the API server.
curl --location 'https://admin.int.mccdev02.dev.infra.webex.com:6442/readyz?verbose=null' -k
[+]ping ok
[+]log ok
[+]etcd ok
[+]informer-sync ok
[+]poststarthook/start-kube-apiserver-admission-initializer ok
[+]poststarthook/generic-apiserver-start-informers ok
[+]poststarthook/priority-and-fairness-config-consumer ok
[+]poststarthook/priority-and-fairness-filter ok
[+]poststarthook/start-apiextensions-informers ok
[+]poststarthook/start-apiextensions-controllers ok
[+]poststarthook/crd-informer-synced ok
[+]poststarthook/bootstrap-controller ok
[+]poststarthook/rbac/bootstrap-roles ok
[+]poststarthook/scheduling/bootstrap-system-priority-classes ok
[+]poststarthook/priority-and-fairness-config-producer ok
[+]poststarthook/start-cluster-authentication-info-controller ok
[+]poststarthook/aggregator-reload-proxy-client-cert ok
[+]poststarthook/start-kube-aggregator-informers ok
[+]poststarthook/apiservice-registration-controller ok
[+]poststarthook/apiservice-status-available-controller ok
[+]poststarthook/kube-apiserver-autoregistration ok
[+]autoregister-completion ok
[+]poststarthook/apiservice-openapi-controller ok
[+]shutdown ok
readyz check passed
K8S Cluster Availability can be tested by Synthetic Heart plugin ApiCall. But some required features of plugin need to be supported: - Verify plain text response body by keyword, wildcard or regex expression - Skip tls verification (-k | --insecure)
Synthetic Heart is pushing the test result as metrics to in-cluster Prometheus. SLI calculation can be done by in-cluster Prometheus Recording Rule offloading calculate effort on central side.
groups:
  - name: sli_platform
    rules:
    - record: job:apiserver_readyz_failures:rate_1m
      expr: sum by (job) (rate(apiserver_readyz_failures{job="apiserver"}[1m]))
    - record: job:apiserver_readyz_total:rate_1m
      expr: sum by (job) (rate(apiserver_readyz_total{job="apiserver"}[1m]))
    - record: job:apiserver_failures_per_readyz_request:ratio_rate_1m
      expr: |
        1 - job:apiserver_readyz_failures:rate_1m / job:apiserver_readyz_total:rate_1m
    labels:
      cluster: {clusterName}
3.1.2 Platform Critical Service Availability 
This measures the percentage of time that your Platform services are available and operational over a given period of time.
Services availability is measured by collecting liveness/readiness API as health check result, usually the value of SLI should grater than 99.5%. The test result also will be exported as metrics like cluster availability do. A table list the critical services and their check API and metrics name:
| Critical Service | Health Check API | Metrics Name |
|---|---|---|
| Infra Service | https://infra.int.{cluster}.{env}.infra.webex.com/healthz | infraservice_heathz_failures infraservice_heathz_total |
| Kdapi | https://kdapi.int.{cluster}.{env}.infra.webex.com/healthz | kdapi_heathz_failures kdapi_heathz_total |
| Single Pane | https://ui.int.{cluster}.{env}.infra.webex.com/ | single_pane_html_failures single_pane_html_total |
| GHE | https://synheart.int.{cluster}.{env}.infra.webex.com/api/v1/tests/status | syntheticheart_http_ping_latency |
| Keeper | https://synheart.int.{cluster}.{env}.infra.webex.com/api/v1/tests/status | syntheticheart_http_ping_latency |
| DNS | https://synheart.int.{cluster}.{env}.infra.webex.com/api/v1/tests/status | syntheticheart_dns_repeat_count |
| PagerDuty | https://synheart.int.{cluster}.{env}.infra.webex.com/api/v1/tests/status | syntheticheart_http_ping_latency |
Measure and Calculate SLI Critical Service Availability
Some extra features of Synthetic Heart plugin ApiCall need to be supported: - Verify HTTP call which responses an HTML page
This SLI also calculated in in-cluster Prometheus with recording rule.
3.1.3 Endpoints Availability by Cilium Metrics 
The metrics of Cilium unreachable_health_endpoints indicates number of endpoints that cannot be reached, endpoint_state indicates count of all endpoints
Endpoints Availability (%) =(endpoint_state - unreachable_health_endpoints)/ endpoint_state X 100
Where to measure Endpoints Availability
Directly create recording rule to calculate SLI Endpoints Availability
groups:
  - name: sli_platform
    rules:
    - record: job:endpoint_state:sum
      expr: sum by(job)(cilium_endpoint_state{job="kubernetes-pods",endpoint_state="ready"})
    - record: job:unreachable_health_endpoints:sum
      expr: sum by(job)(cilium_unreachable_health_endpoints)
    - record: job:unreachable_endpoints_ratio:ratio_sum
      expr: |
        1- job:unreachable_health_endpoints:sum / job:endpoint_state:sum
3.1.4 Total SLA for All Cluster 
Collect SLI data from each cluster and calculate the total SLA in a central service.
K8s Cluster Availability (%)=avg by(cluster)(job:apiserver_failures_per_readyz_request:ratio_rate_1m)Critical Service Availability (%)=avg by(cluster)(job:{service_name}_failures_per_healthz_request:ratio_rate_1m)Endpoints Availability (%)=avg by(cluster)(job:unreachable_endpoints_ratio:ratio_sum)
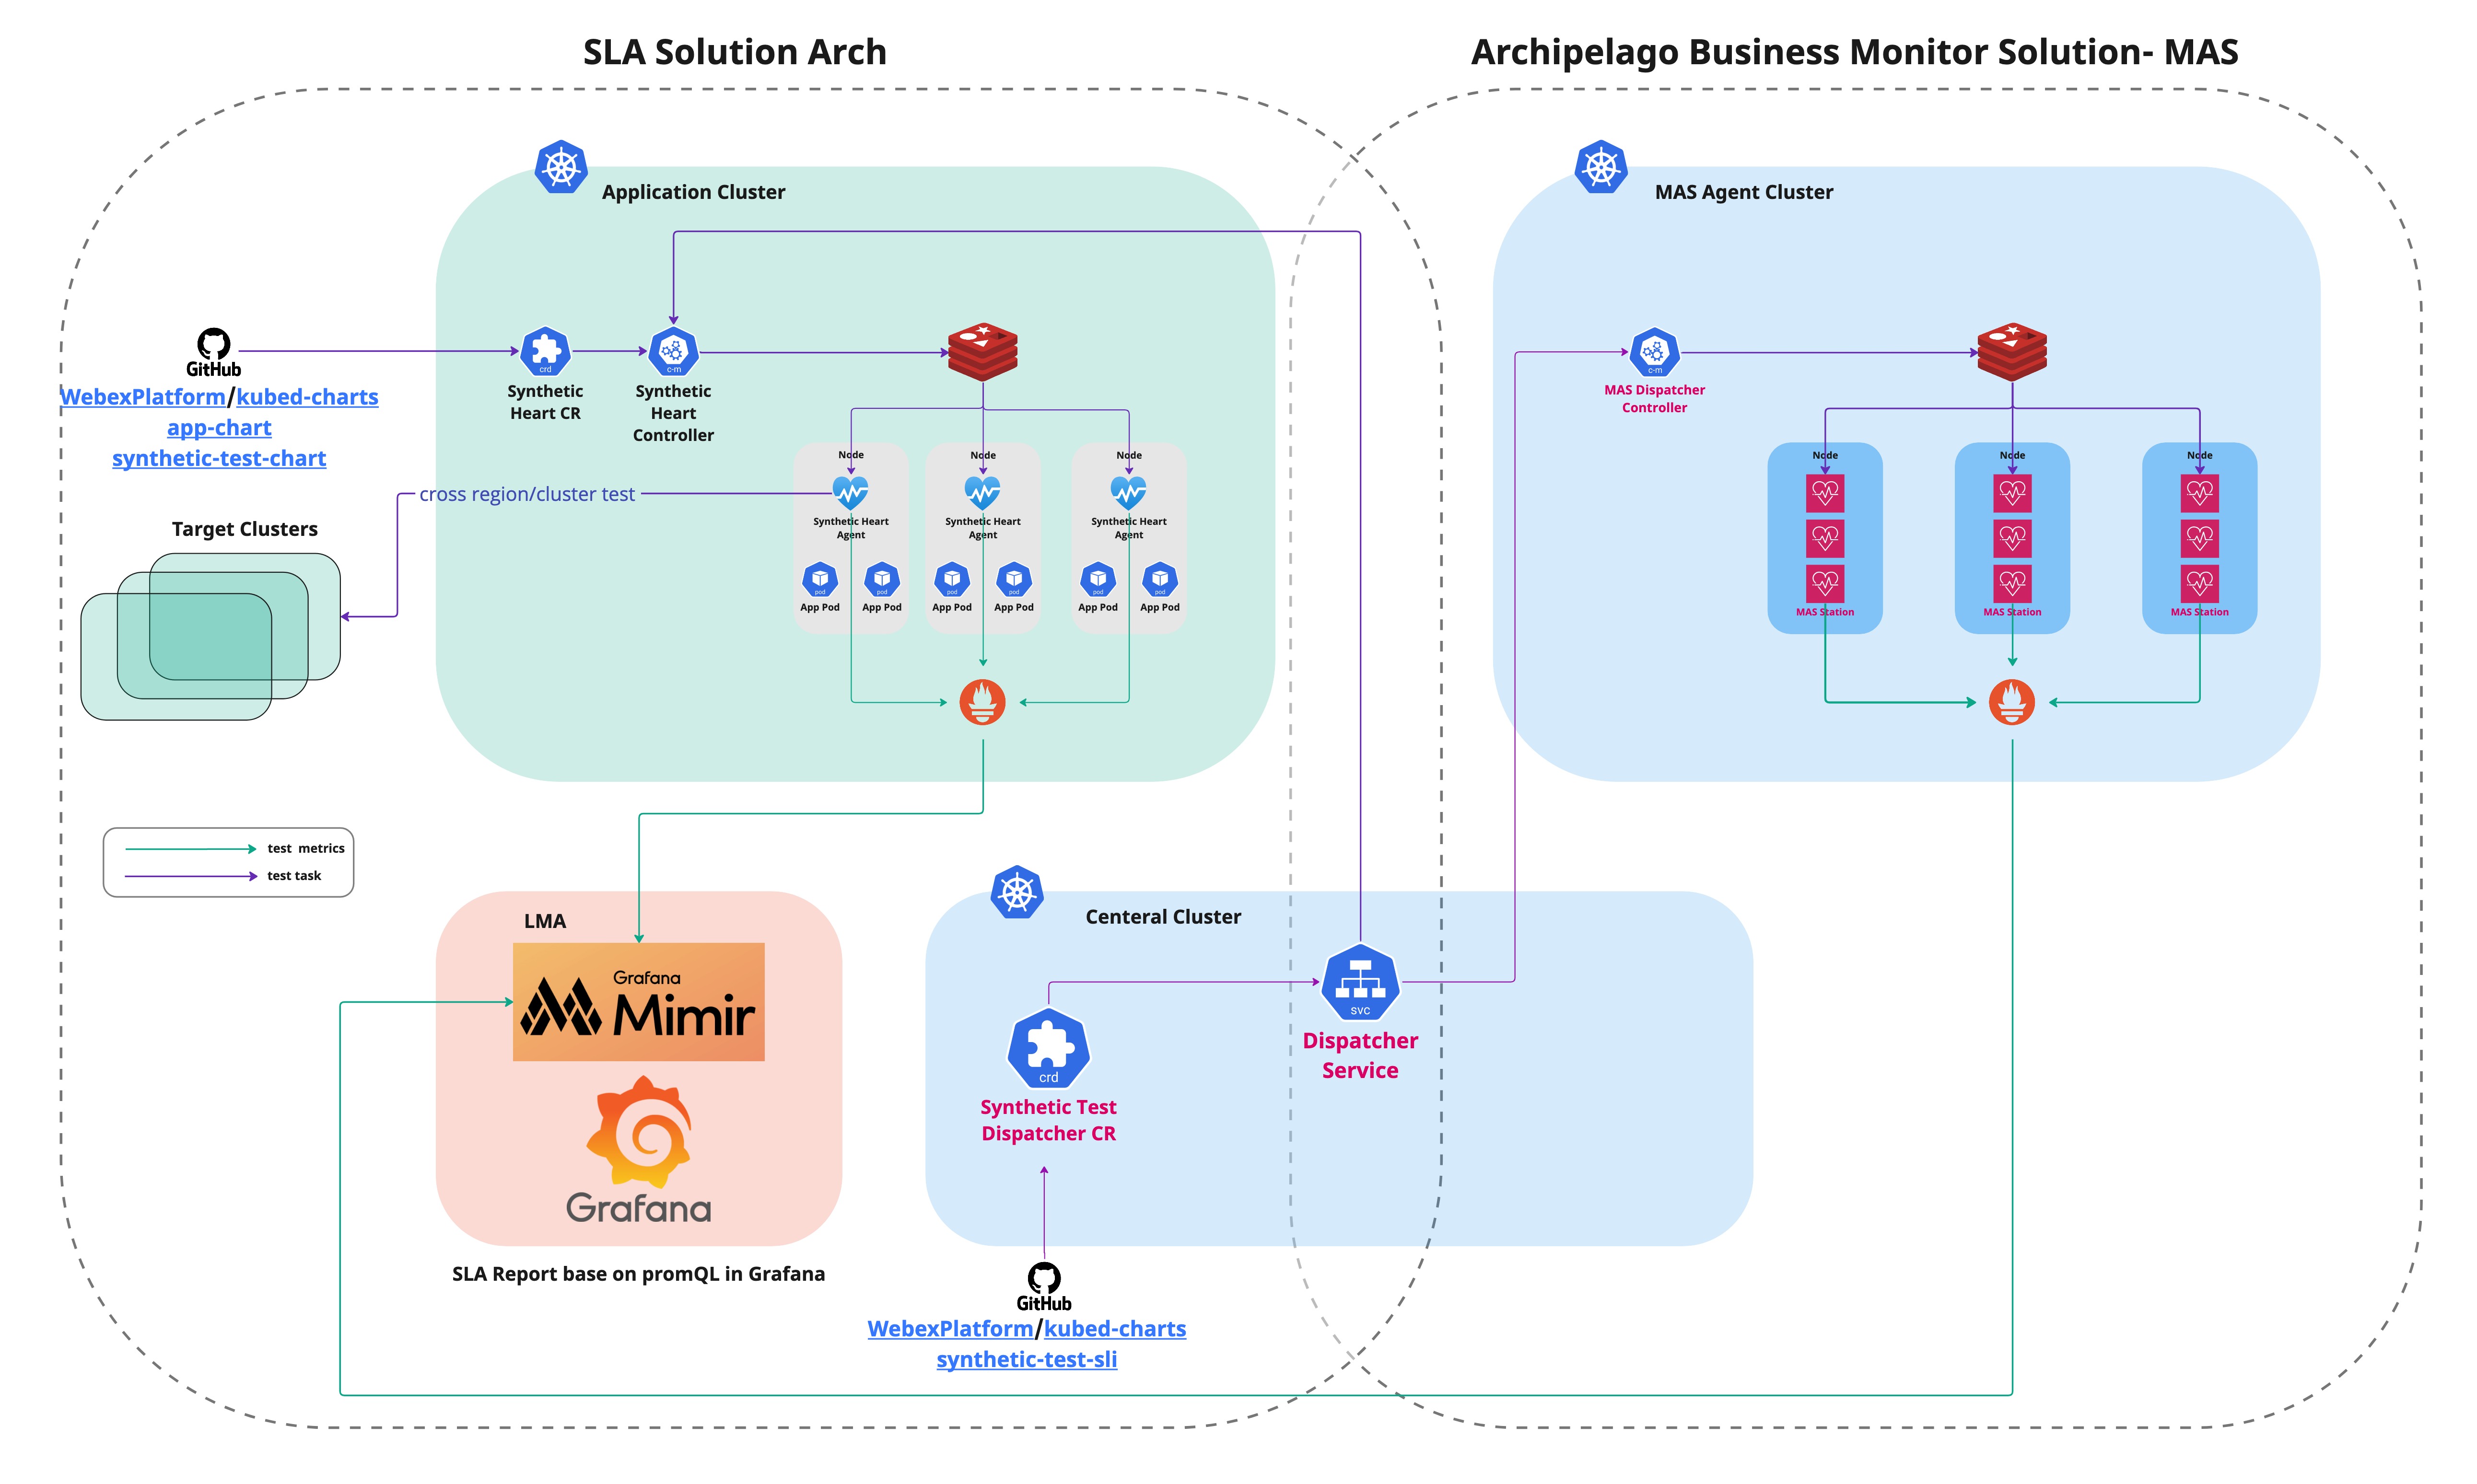
3.2 SLA Arch and Dataflow 
Prerequisites(Todo list): 
- Build new center cluster and deploy
Central Dispatcher Central Dispatcherand in clusterSynthetic Heart Controllerare able to talk with each other for task dispatchSynthetic Heart Agenthave enough plugin to cover all need metrics for SLA- Create recording rule mentioned in SLI definition in repo kubed-synthetic-heart-tests
- Create
SyntheticTestDispatcherCRD object in new repo 'kubed-synthetic-heart-sli' forCentral dispatcherassigning test tasks## SyntheticTestDispatch CR apiVersion: synheart.infra.webex.com/v1 kind: SyntheticTestDispatcher metadata: name: sli-cluster-availability-dispatcher spec: cloudProvider: AWS # default value of dispatchStrategy is 'customized'. # if value is 'customized', use value of 'testCluster' as test worker # if value is 'auto', automatically pick up an available test worker located specific 'cloudProvider'/'env' dispatchStrategy: customized | auto testCluster: aorewxt-prd-1 targetCLuster: aorewxt-prd-2 systheticTest: plugin: apiCall node: $ displayName: API Call for K8S Cluster Availability description: Test API Server readyz endpoint of aorewxt-prd-2 timeouts: run: 2m repeat: 5m config: | address: https://admin.int.aorewxt-prd-2.prod.infra.webex.com:6442/readyz?verbose=null expectedCodeRegex: 200 retries: 1
Flow 
- In repo 'kubed-synthetic-heart-sli', define
SyntheticTestDispatcherCRD object which is similar to Synthetic Heart CR Central Dispatcherreconciles CR and assign the task to in-clusterSynthetic Heart ControllerSynthetic Heart Controllerstore task into redis andSynthetic Heart Agentget task from redis start do cross cluster test- The test result will push to in cluster Prometheus
- Prometheus will remote-write all test result LMA Mimir
- All the data are visible in LMA Grafana, we can create SLA report base on section #3.1 via PromQL
Highlights 
- The flow #3-#5 remain no change of current Synthetic Heart work flow
- This Centralized management based design will make sure no change and workable of current Synthetic Heart test registration and test work flow
- The
Central Dispatcheris leveraging the same thing in Archipelago Business Monitor Solution- MAS Center Dispatcher - The
Central Dispatcherdown will not impact SLA data collection, only affect the new SLA data collect requirement apply to all cluster
3.3 SLA Report & Alerting 
We will create SLA report in LMA Grafana base on promQL to show SLA of cluster, platform, application.
We can set SLA alert on Grafana.
6. Security Implications 
N/A
7. HA and Reliability Posture 
- The SLA HA is based on existing Synthetic Heart test HA
- Center dispatcher down will not impact SLA data collection, only impact dispatch task assignment.
8. Risks and Unknowns 
N/A
9. Rollout Plan 
TODO