Post Validation for Webexkubed Cluster Build 
Authors: George He, Whisper Wang
1. Overview 
This RFC is to provide a solution for post validation when bring up or rebuild a Webexkubed cluster.
2. Background & Motivation 
Webexkubed cluster is consist of multiple platform systems/components which have been defined in Backstage. This definition outlines a Webexkubed cluster which guides operation and development team to break down the tasks. Cluster build team also setup a post validation checklist for a new or rebuild cluster. Naturally, mapping the platform systems to post-validation check items results in a more effective classification.
| Backstage Platform System | Post Validation | Related Backstage Platform Component |
|---|---|---|
| Kubernetes Cluster | 1. Control Plane Health 2. ingress pool health | Kubernetes Control Plane Kubed Ingressproxy |
| Infrastructure as Code | 1. worker nodes health, number same as planned | Infractl?Federated Infra? |
| Service Mesh | 1. istio ingress-gateway access log | |
| Monitoring Stack | 1. monotirong apps health, metrics able to be foward to LMA | prometheus |
| Streaming | kafka base apps health, logs able to be foward to LMA | strimzi-kafka kubed-fluent-bit Kafka Communicator |
| Certificate Management | cert-manager can issue certificates for authorized domains | cert-manager |
| Cloud Provider Controllers | check if any anti-affinity conflict in OCP instance | openstack-cloud-controller-manager |
| Cluster DNS | 1. internal-provider network ping test 2. public network ping test | CoreDNS External Dns |
3. Proposed Solution 
Leverage possible monitoring approaches to measure the health status of platform systems.
- LMA Metrics 2.0: metrics.o.webex.com
- MCT ESCountMonitor: https://wiki.cisco.com/display/CAME/ESCountMonitor+monitoring+logic
- MCT Health Check: https://mct.webex.com/docs/pluginGuide/URLWatch.html
- Synthetic Heart: https://sqbu-github.cisco.com/WebexPlatform/synthetic-heart
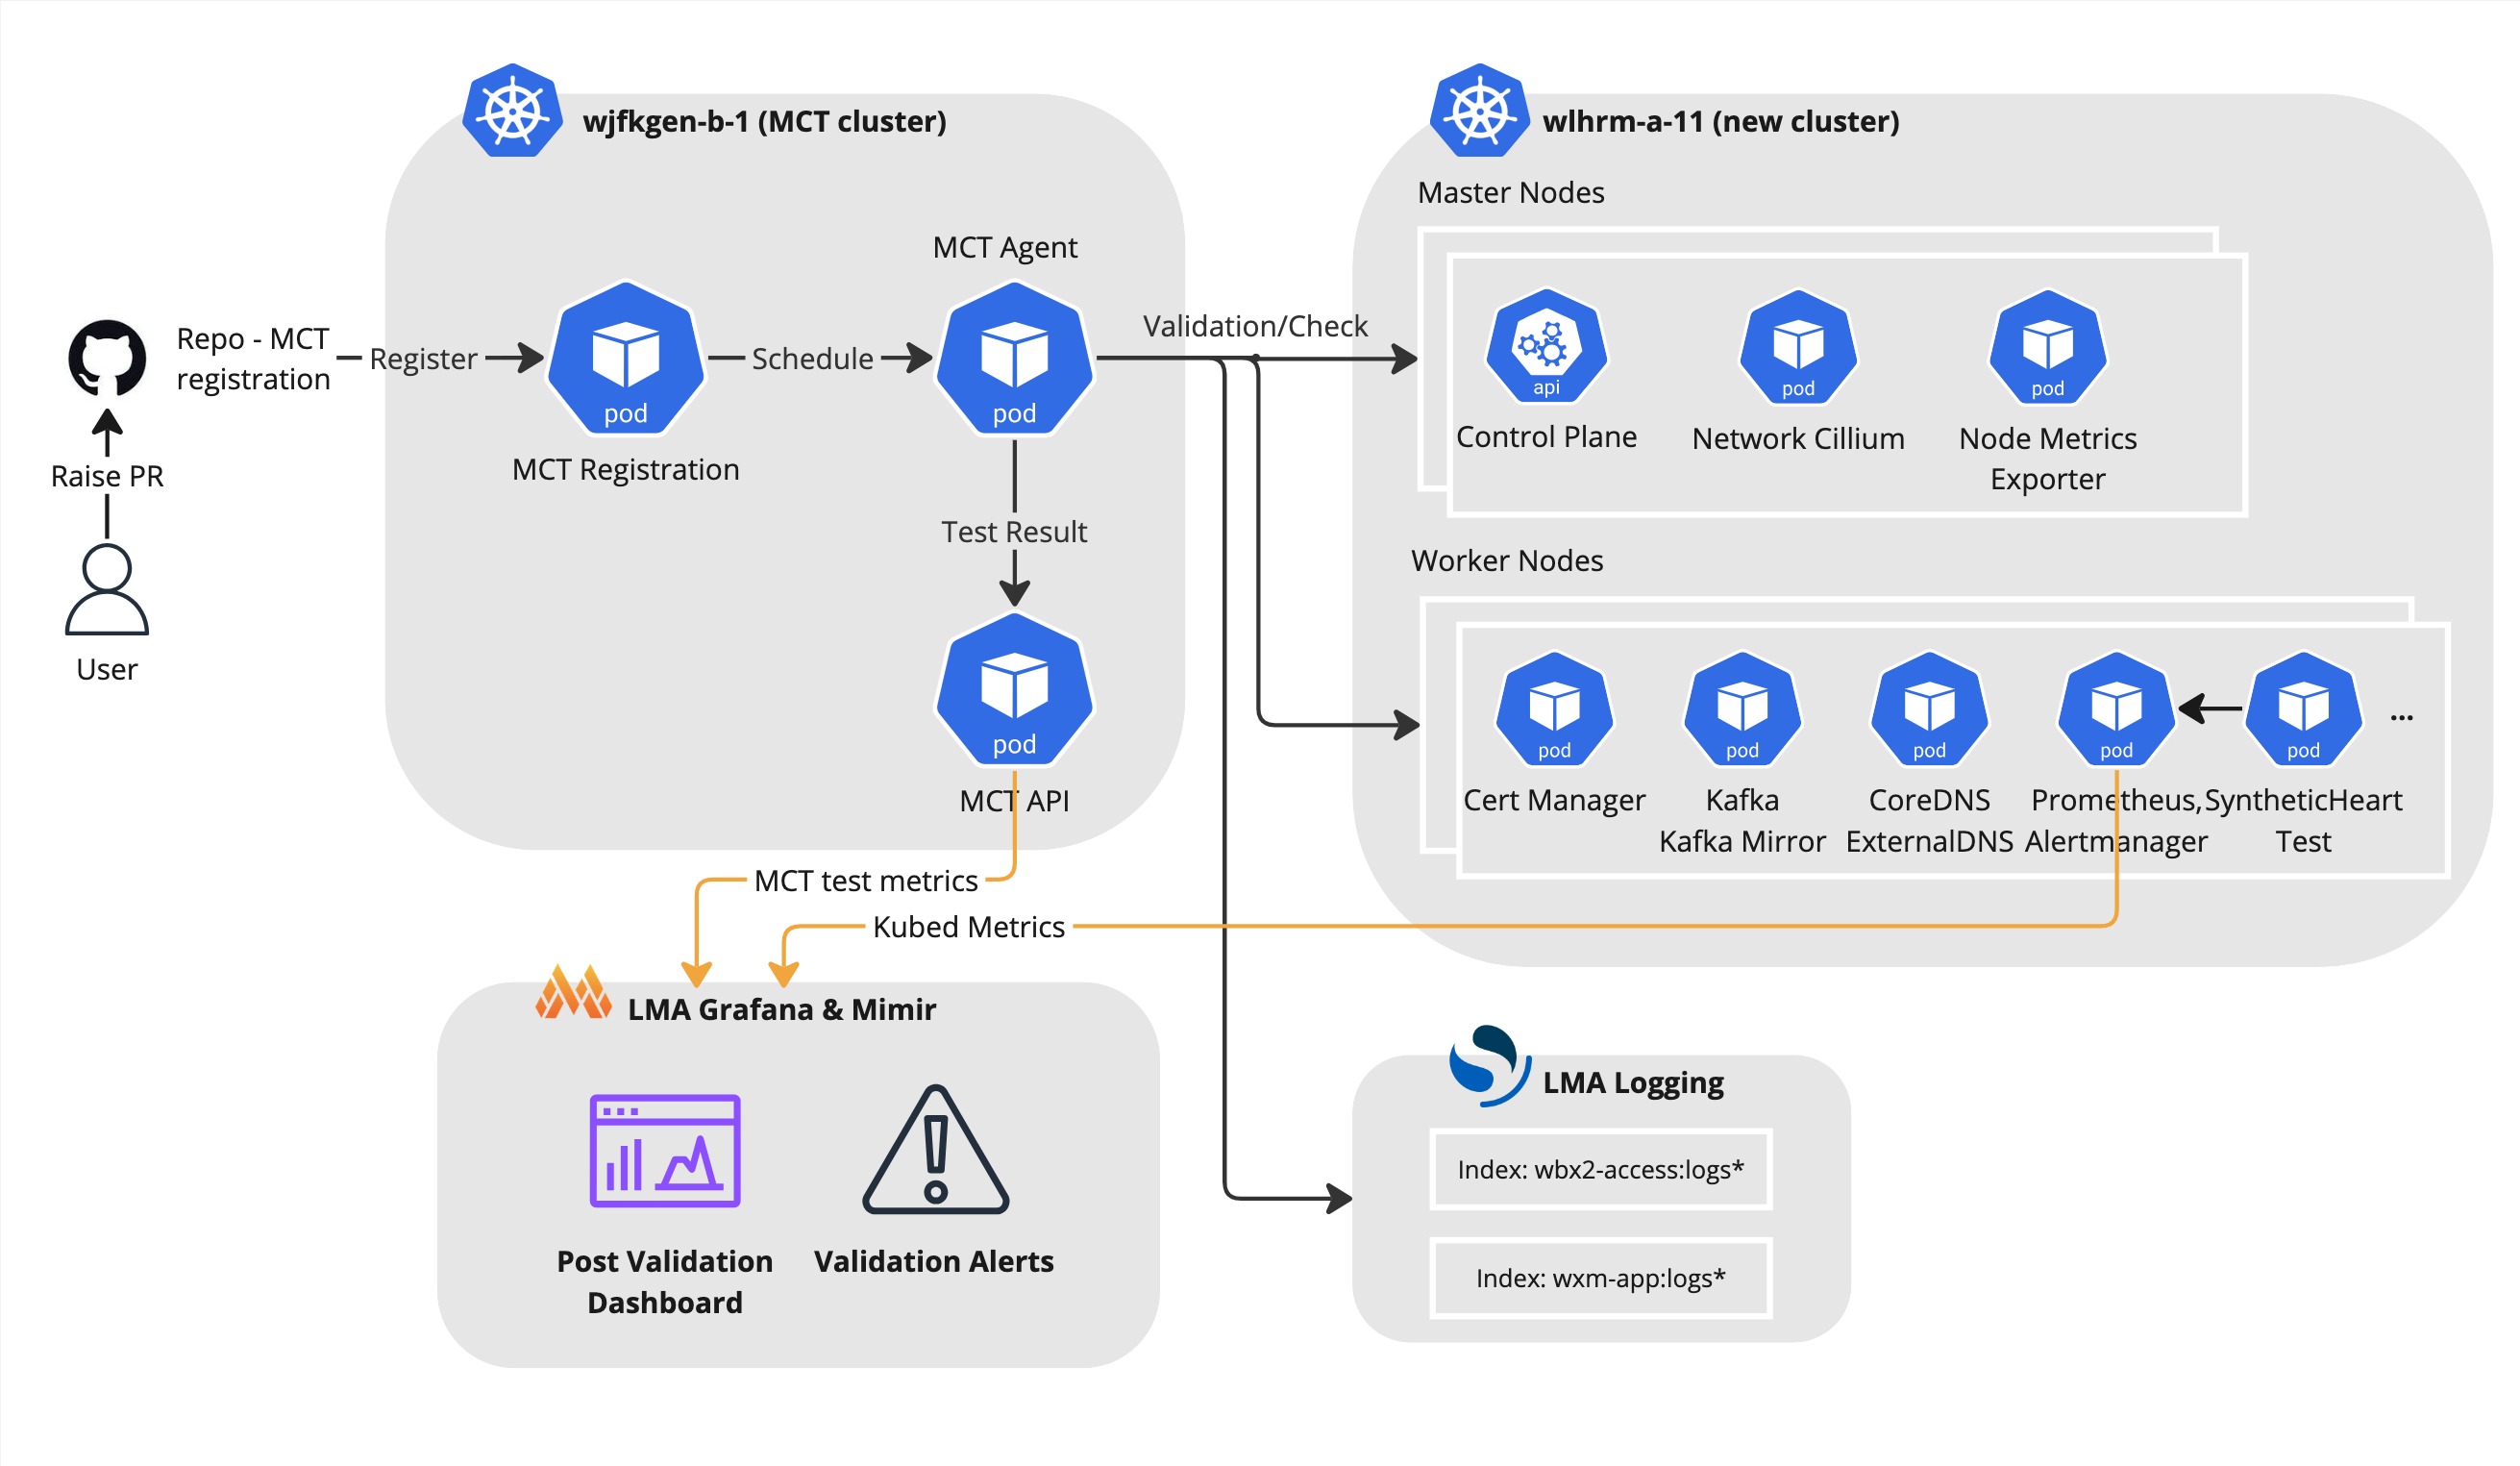
User Need for Post Validation
- MCT check registration for validating by MCT agent which will send test metrics to LMA metrics 2.0, please check 3.2.1 central cluster registration
- Define custom service/pod monitor to scrap Prometheus metrics except built-in metrics. Built-in metrics is provided by split-prometheus covering kubelet, kubed-state-metrics, node, dns, etc.
Check Post Validation Dashboard
- Check Grafana dashboard for post validation per cluster in metrics.o.webex.com
- Post validation dashboard collect all checks from multiple monitoring tools.
3.1 Measurement of Platform System 
3.1.1 Kubernetes Cluster 
Control Plane Health
Follow the EKS and AKS measurement approach, MCT URLWatch has capabilities to monitor the health status of Kubernetes API health endpoints and match the responses with response_code, regex, plain text.
curl --location 'https://admin.int.mccprod06.prod.infra.webex.com:6442/readyz?verbose=null' -k
[+]ping ok
[+]log ok
[+]etcd ok
[+]informer-sync ok
[+]poststarthook/start-kube-apiserver-admission-initializer ok
[+]poststarthook/generic-apiserver-start-informers ok
[+]poststarthook/priority-and-fairness-config-consumer ok
[+]poststarthook/priority-and-fairness-filter ok
[+]poststarthook/start-apiextensions-informers ok
[+]poststarthook/start-apiextensions-controllers ok
[+]poststarthook/crd-informer-synced ok
[+]poststarthook/bootstrap-controller ok
[+]poststarthook/rbac/bootstrap-roles ok
[+]poststarthook/scheduling/bootstrap-system-priority-classes ok
[+]poststarthook/priority-and-fairness-config-producer ok
[+]poststarthook/start-cluster-authentication-info-controller ok
[+]poststarthook/aggregator-reload-proxy-client-cert ok
[+]poststarthook/start-kube-aggregator-informers ok
[+]poststarthook/apiservice-registration-controller ok
[+]poststarthook/apiservice-status-available-controller ok
[+]poststarthook/kube-apiserver-autoregistration ok
[+]autoregister-completion ok
[+]poststarthook/apiservice-openapi-controller ok
[+]shutdown ok
readyz check passed
v1.27, clusters start to publish Service Level Indicator (SLI) metrics for each Kubernetes component binary. This metric endpoint is exposed on the serving HTTPS port of each component, at the path /metrics/slis. K8S cluster SLI metrics can be scraped by external Prometheus outside of cluster. ScrapeConfig CRD can be used to create scrape configurations to scrape targets outside of cluster. Helm chart [kubed-scrape] is dedicated to create ScrapeConfig CR.
apiVersion: monitoring.coreos.com/v1alpha1
kind: ScrapeConfig
metadata:
  name: new-cluster-sli-sd
  namespace: my-namespace
  labels:
    prometheus: system-monitoring-prometheus
    app.kubernetes.io/name: scrape-config-example
spec:
  httpSDConfigs:
    - url: https://admin.int.{new-cluster}.prod.infra.webex.com:6442/metris/sli
      refreshInterval: 15s
Ingress pool health
MCT ESCountMonitor has capabilities to monitor K8S Nginx Ingress access logs.
LMA ingress access log example: https://logs.o.webex.com/goto/9cfcf391169db69d0b6f16dccc9b1332?security_tenant=global
3.1.2 Infrastructure as Code 
Worker nodes health
Kubernetes officially recommend to use node problem detector to detect node issues:
- SystemLogMonitor: A system log monitor monitors system log and reports problems and metrics according to predefined rules.
- SystemStatsMonitor: A system stats monitor for node-problem-detector to collect various health-related system stats as metrics.
- CustomPluginMonitor: A custom plugin monitor for node-problem-detector to invoke and check various node problems with user-defined check scripts.
- HealthChecker: A health checker for node-problem-detector to check kubelet and container runtime health.
Prometheus Metrics exposed by node-problem-detector help measure node health state.
PromQL: sum({job="node-problem-detector", reason!= ""}) by (reason) ->
{reason="CorruptDockerImage"}
{reason="CorruptDockerOverlay2"}
{reason="DockerContainerStartupFailure"}
{reason="DockerHung"}
{reason="Ext4Error"}
{reason="Ext4Warning"}
{reason="FilesystemIsReadOnly"}
{reason="IOError"}
{reason="KernelOops"}
{reason="MemoryReadError"}
{reason="OOMKilling"}
{reason="TaskHung"}
{reason="UnregisterNetDevice"}
Node number same as planned
TBD: how to expose the Terraform apply result and Check real node number in cloud_provider
OCP affinity
OCP team has a Grafana dashboard to check if any anti-affinity conflict in OCP instance. Example query
3.1.3 Service Mesh 
Istio ingressgateway health check
MCT port check plugin helps monitor the port connectivity of each istio ingressgateways. The plugin mechanism is to detect the connectivity of port(443) that takes over traffic like telnat does.
telnet worker-aaf5.acmhwxt-prd-1.prod.infra.webex.com 443
Ingressgateway access log
Same as nginx ingress access log monitor, use MCT ESCountMonitor plugin to check access log exist.
Ingressgateway access log example: https://logs.o.webex.com/goto/3b3fabbaa671b734300e7f081c6280d7?security_tenant=global
3.1.4 Certificate Management 
Cert manager SLI have been defined in metrics 2.0 dashboard, and cert management validation can be measured by metrics as below:
- Number of expired certificate
- Expired service certificates
- Expired cluster node certificates
- Cert manager availability
3.1.5 Streaming 
Streaming(Kafka & Kafka communicator) SLI will be defined in metrics 2.0 dashboard, and Streaming validation can be measured by metrics as below:
- Message Throughput: Kafka Throughput(MB/s), Mirror In/Out (Msg/s)
- Consumer Lag: Lag for consumer group per cluster
- Error Rates: Produce request error rate, Fetch request error rate
- Replication Lag: Under Replicated Partition
- Broker Availability: Broker online count
- Partition Availability: Offline partition count
3.1.6 Monitoring Stack 
At the moment, Split Prometheus dashboard helps self monitor components of monitoring stack.
3.1.7 Cluster DNS 
Follow the DNS SLI measurement.
3.2 MCT Registration 
MCT has two registration ways which are central cluster registration and app cluster registration. And you can seek help from MCT team for all the following steps
3.2.1 Central Cluster Registration 
- In kubed-app-registration repo create your own application group folder.
-
Define your application's template YAML
Template is the content you want to monitor. Template variables can be included in the YAML using
{{}}, acting as placeholders for values to be resolved at runtime. A case as below.3. Create infra YAMLglobal_setting: datacenter: "{{datacenter}}" cluster_name: "{{kubed_cluster}}" service: "Monitoring" server_type_list: - name: "ESCountMonitor" serverType: "ESCountMonitor" zone_setting: domainType: 101 zoneType: "ESCountMonitor" zoneTypeName: "ESCountMonitor" zoneName: "Access Log" autoMode: 2 server_setting: svrType: "service" serverIp: "{{kubed_cluster}} - Nginx Ingress Access Log" serverHostname: "{{kubed_cluster}} - Nginx Ingress Access Log" baseUrl: "https://api-logs.o.webex.com/" topic: "wbx2-access:logs*" syntax: 1 dsl: "{\"query\":{\"match_all\":{\"datacenter\":\"{{kubed_cluster}}\"}}}" times: 1Infra YAML defines the number of applications to be registered to MCT for monitoring in each cluster. And pass values to the template variables in
template.yaml. Such as:4. Raise a PRcluster: wlhrm-a-11 environment: Production datacenter: LHR03 kubed_cluster: wlhrm-a-11 cluster_hostname: wlhrm-a-11.prod.infra.webex.com labels: kubed_cluster: wlhrm-a-11 application: cluster_build app-group: platform applications: - name: cluster-build # Corresponding to the template yaml file name timer_interval: 10When the PR is merged into the main branch, MCT will automatically register / update / delete their corresponding monitoring. Then you can see the configured monitoring items on the MCT page.
3.3 Cluster Build Validation Grafana Dashboard 
The delivery of this RFC is a centralized monitoring dashboard for cluster post validation that including all the monitoring results above from multiple data sources. Eventually, MCT test and Synthetic heart test will emit test metrics to LMA and team can setup the dashboard based on the metrics in LMA Grafana Mimir.
4. Security Implications 
5. HA and Reliability Posture 
6. Risks and Unknowns 
This solution rely on LMA Grafana Mimir. Should monitor the status of LMA components: Mimir API, Grafana dashboard, Grafana Alert, etc.
7. Rollout Plan 
- Phase 1 (Aug 16 - Sep 6)
Pilot platform components(3.1.1 kubernetes cluster + 3.1.2 infra as Code) validation ready on a new BTS cluster(wlhrm-a-11), validation is measured by both MCT and kubed Prometheus
- Phase 2 (Sep 7 - Oct 11)
Post validation dashboard ready covering all platform components after cluster bring up.