How metrics collection work
Overview 
WbxKubed platform is lervaging Prometheus + Grafana for metrics. Here we will go deep dive of how the Prometheus + Grafana been install in kubed cluster and how the metrics been collected.
Prometheus & Grafana Installation (Prometheus Operator) 
In kube env, there will be a mass of manual work to manage the config file of Prometheus, so we use a popular operator in community called Prometheus Operator. It will help us install Prometheus + Grafana and manage the config file also provide some auto discovery mechanism etc.
We import the operator as one chart as kubed-monitoring-operator-v2 so that it can be deploy in every cluster run as a micro service.
In this chart we also add some addtional prometheus exporter like node exportor, kube-state-metrics etc.
Metrics Collection 
Prometheus pull the metrics from targets existing in kueb env.
Pod/Container Metrics 
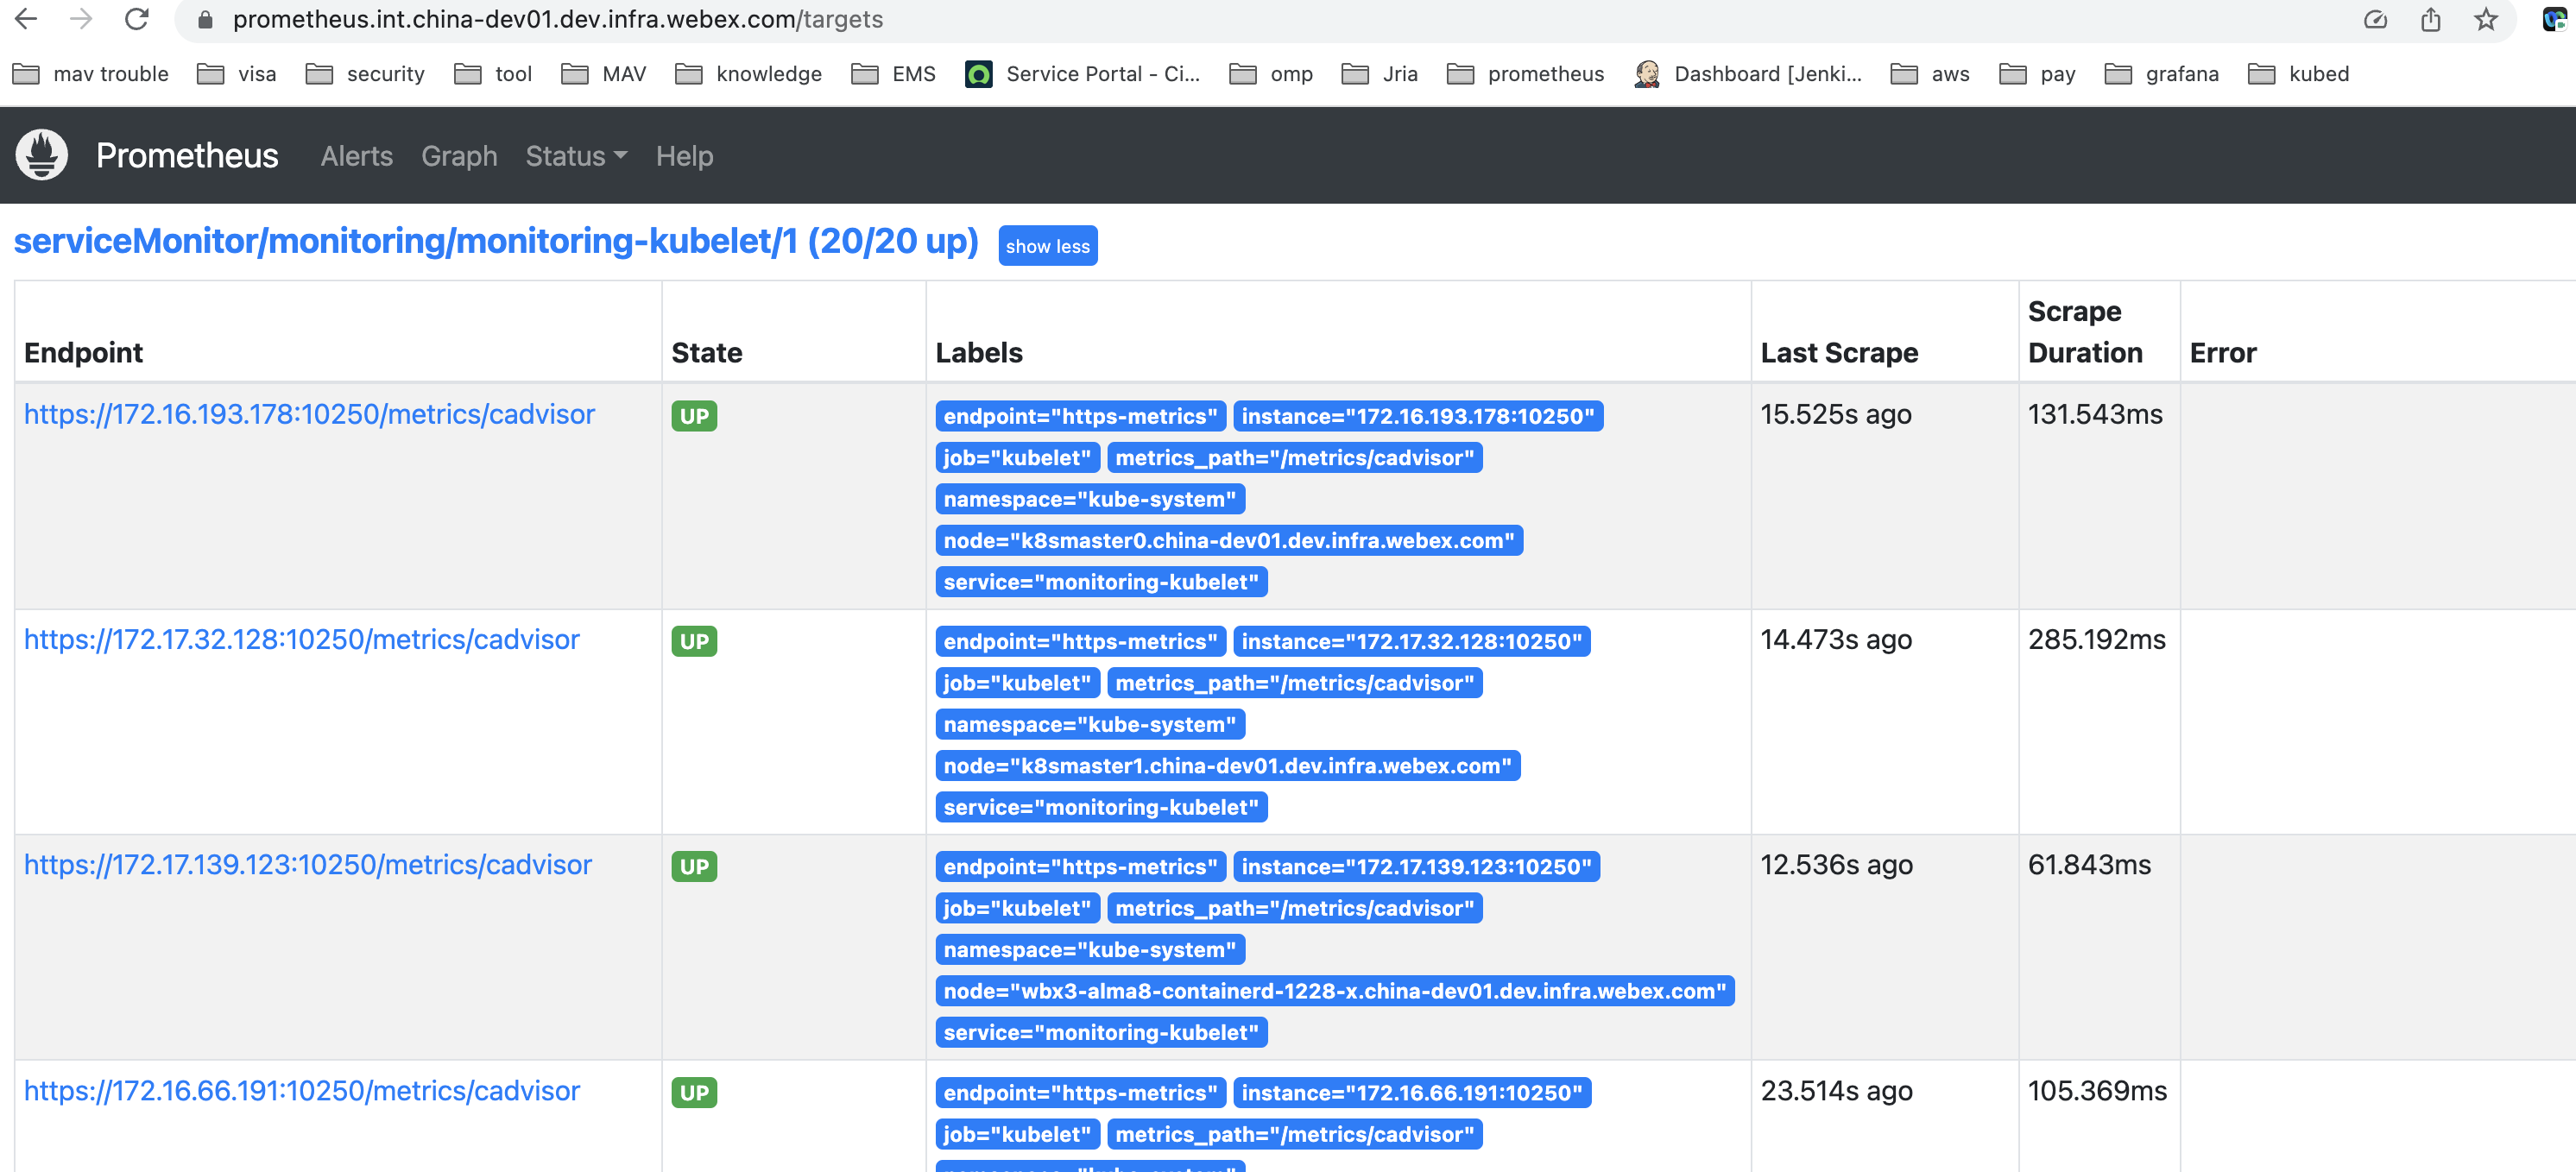
We lervage Kubelet & cadvisor to collectd and expose pod/container level metrics.
Kubelet is a service that runs on each worker node in a Kubernetes cluster and is resposible for managing the Pods and containers on a machine. cAdvisor is a container resource usage and performance analysis tool, open sourced by Google. For monitoring Kubernetes with Prometheus we care about Kubelet and cAdvisor becuase we can scrape metrics from these services regarding container resource usage.
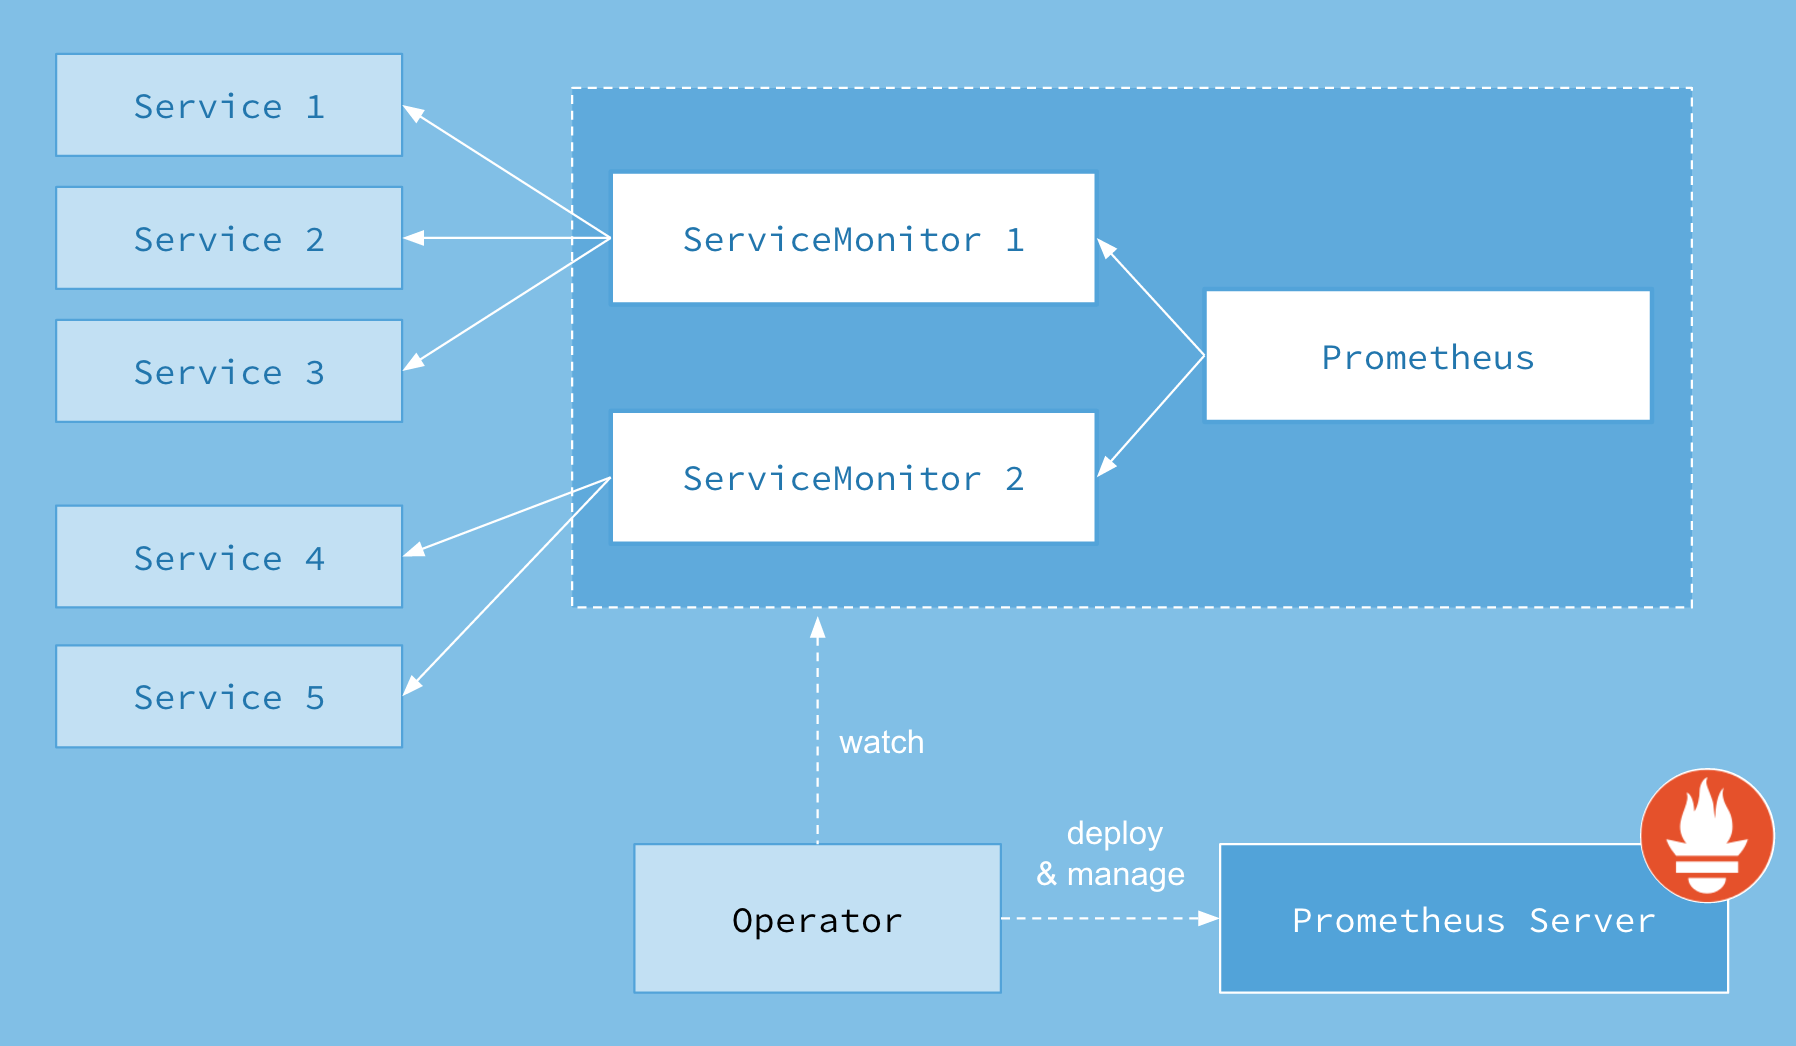
- Prometheus Operator help create Service for kubelet via Operator Deployment;
- Define ServiceMonitor in chart, it will create CR when deploy the chart;
- Prometheus operator by natively deals with ServiceMonitors, it will watch the Service and ServiceMonitor CR then call Prometheus to add targets. * ServiceMonitor Architecture
- Sample Targets
Node(Host) Metrics 
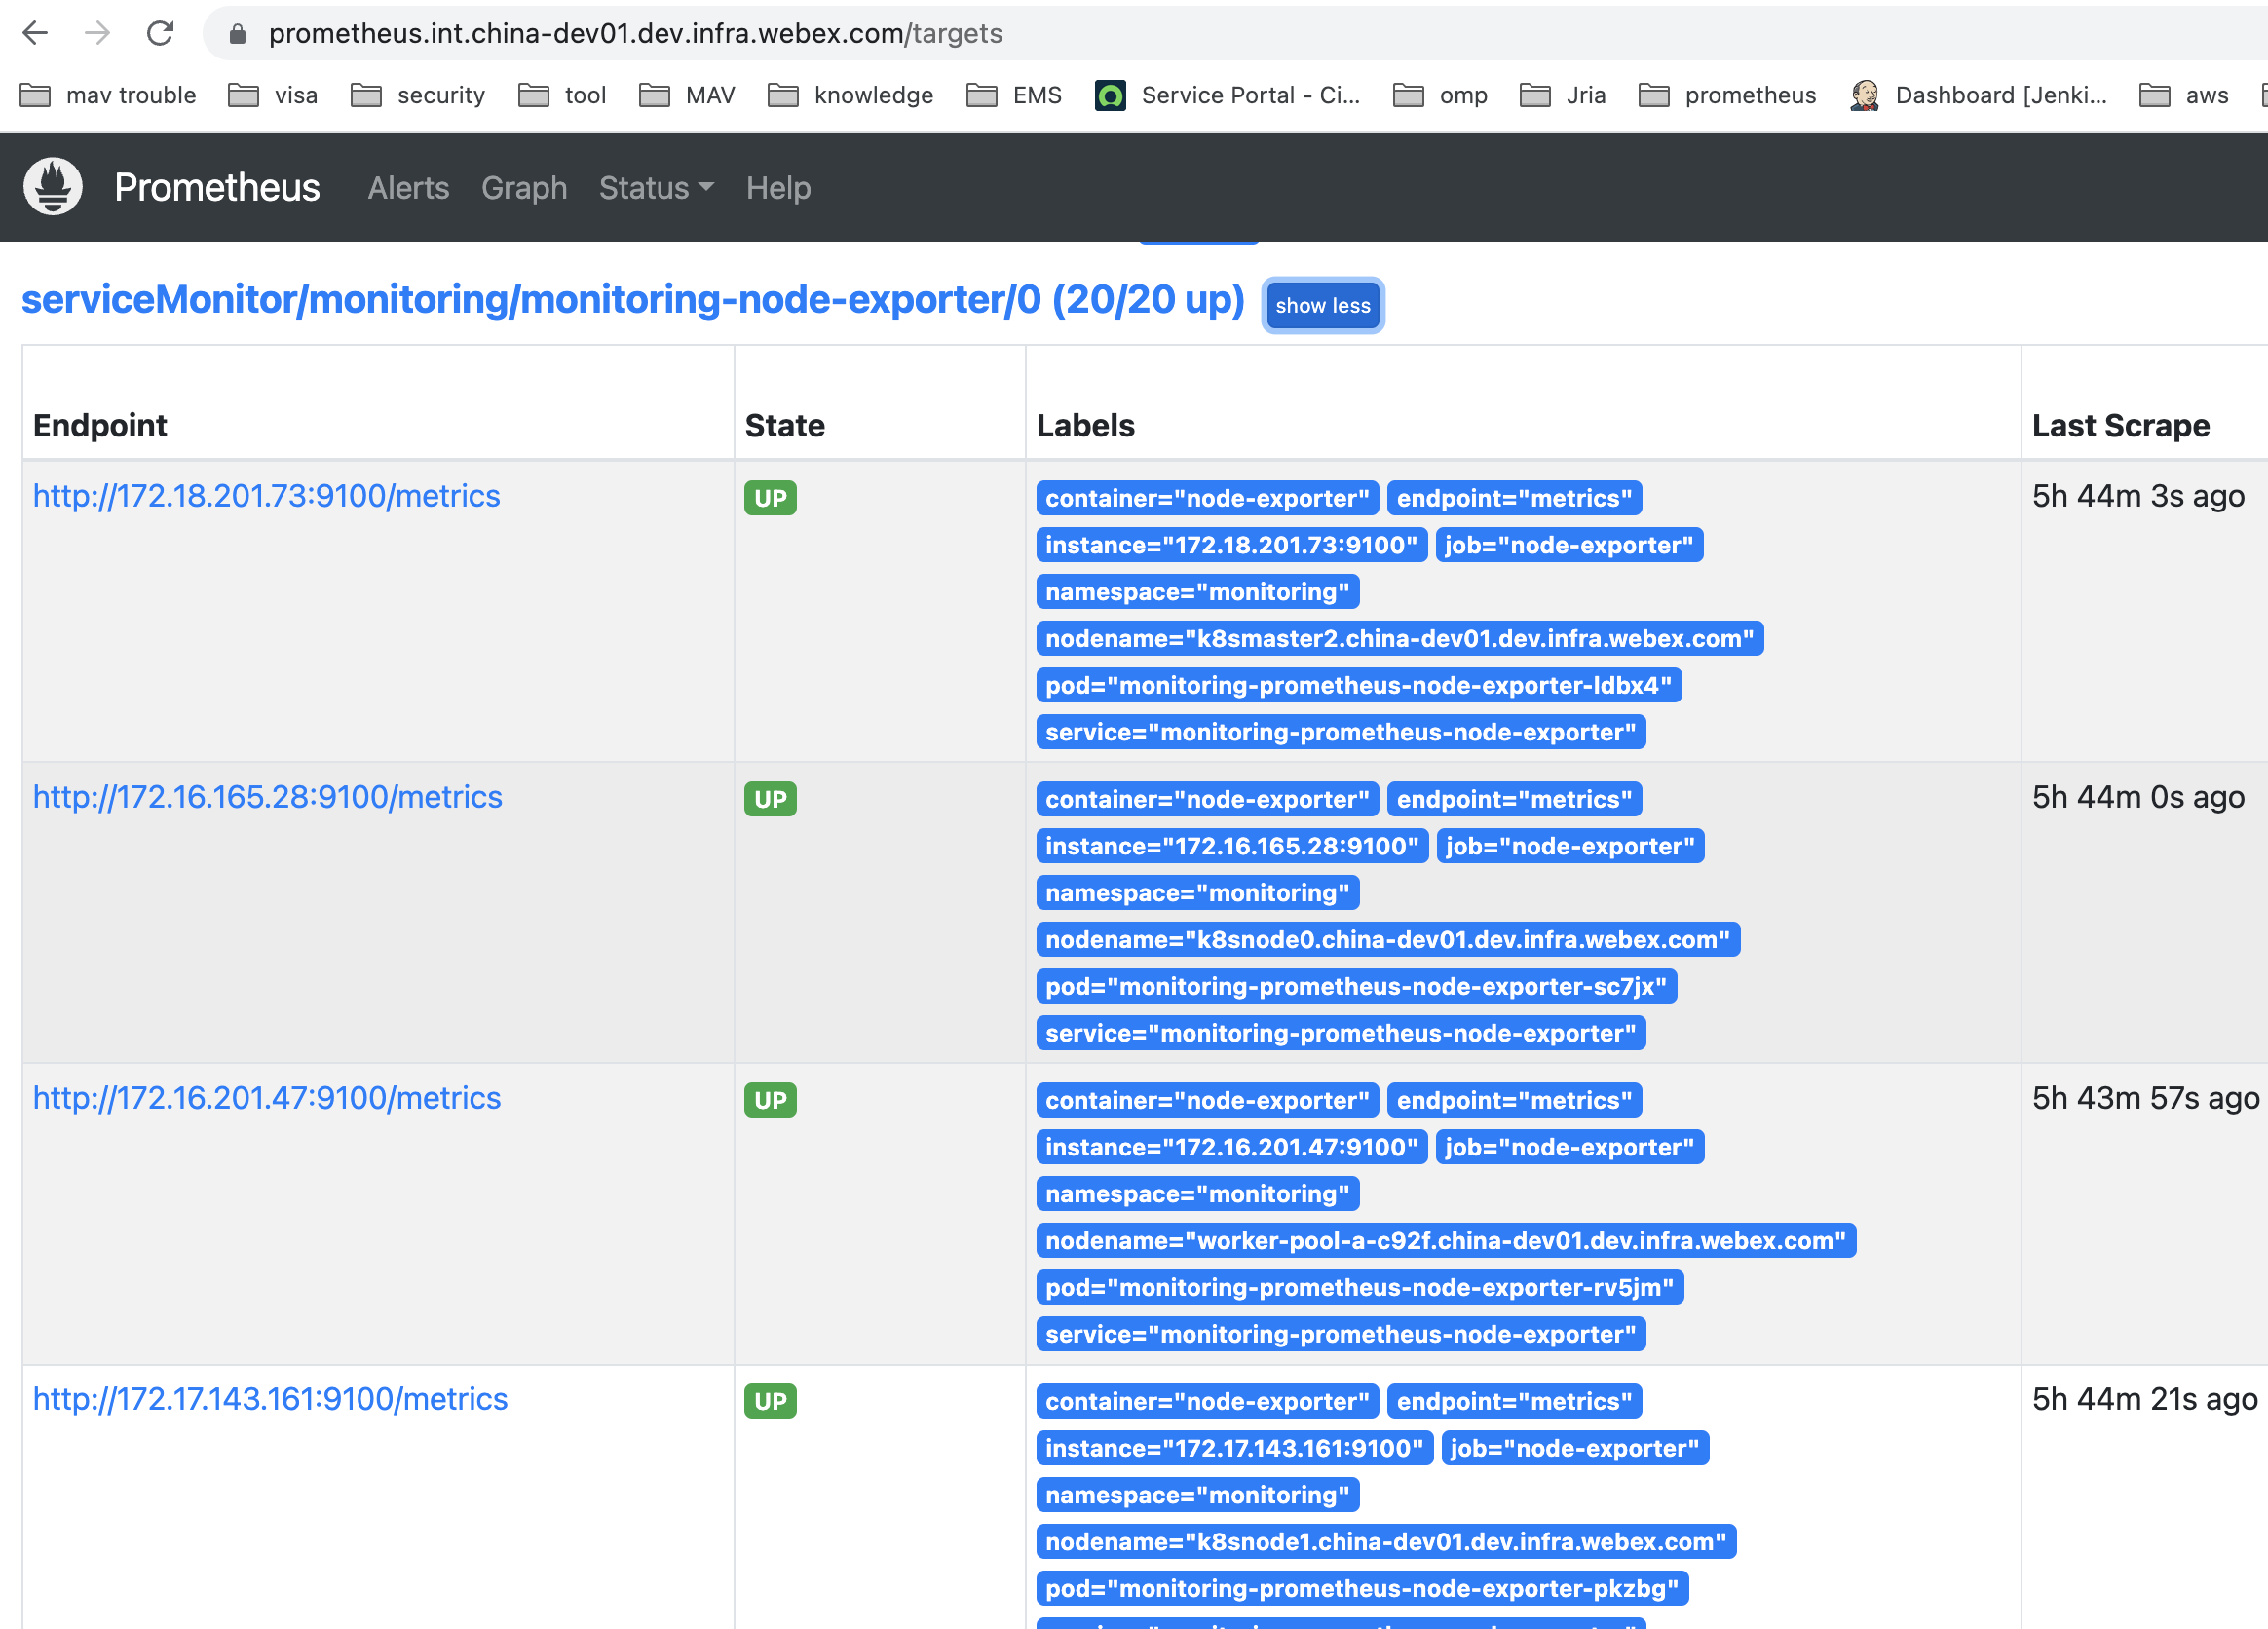
We lervage Prometheus Node Exporter to collect node/host level metrics.
- Prometheus Node exporter been deployed in all kube nodes as a DaemonSet;
- Define ServiceMonitor in chart, it will create CR when deploy the chart;
- Prometheus Operator will watch the Service and ServiceMonitor CR then call Prometheus to add targets.
- Sample Targets
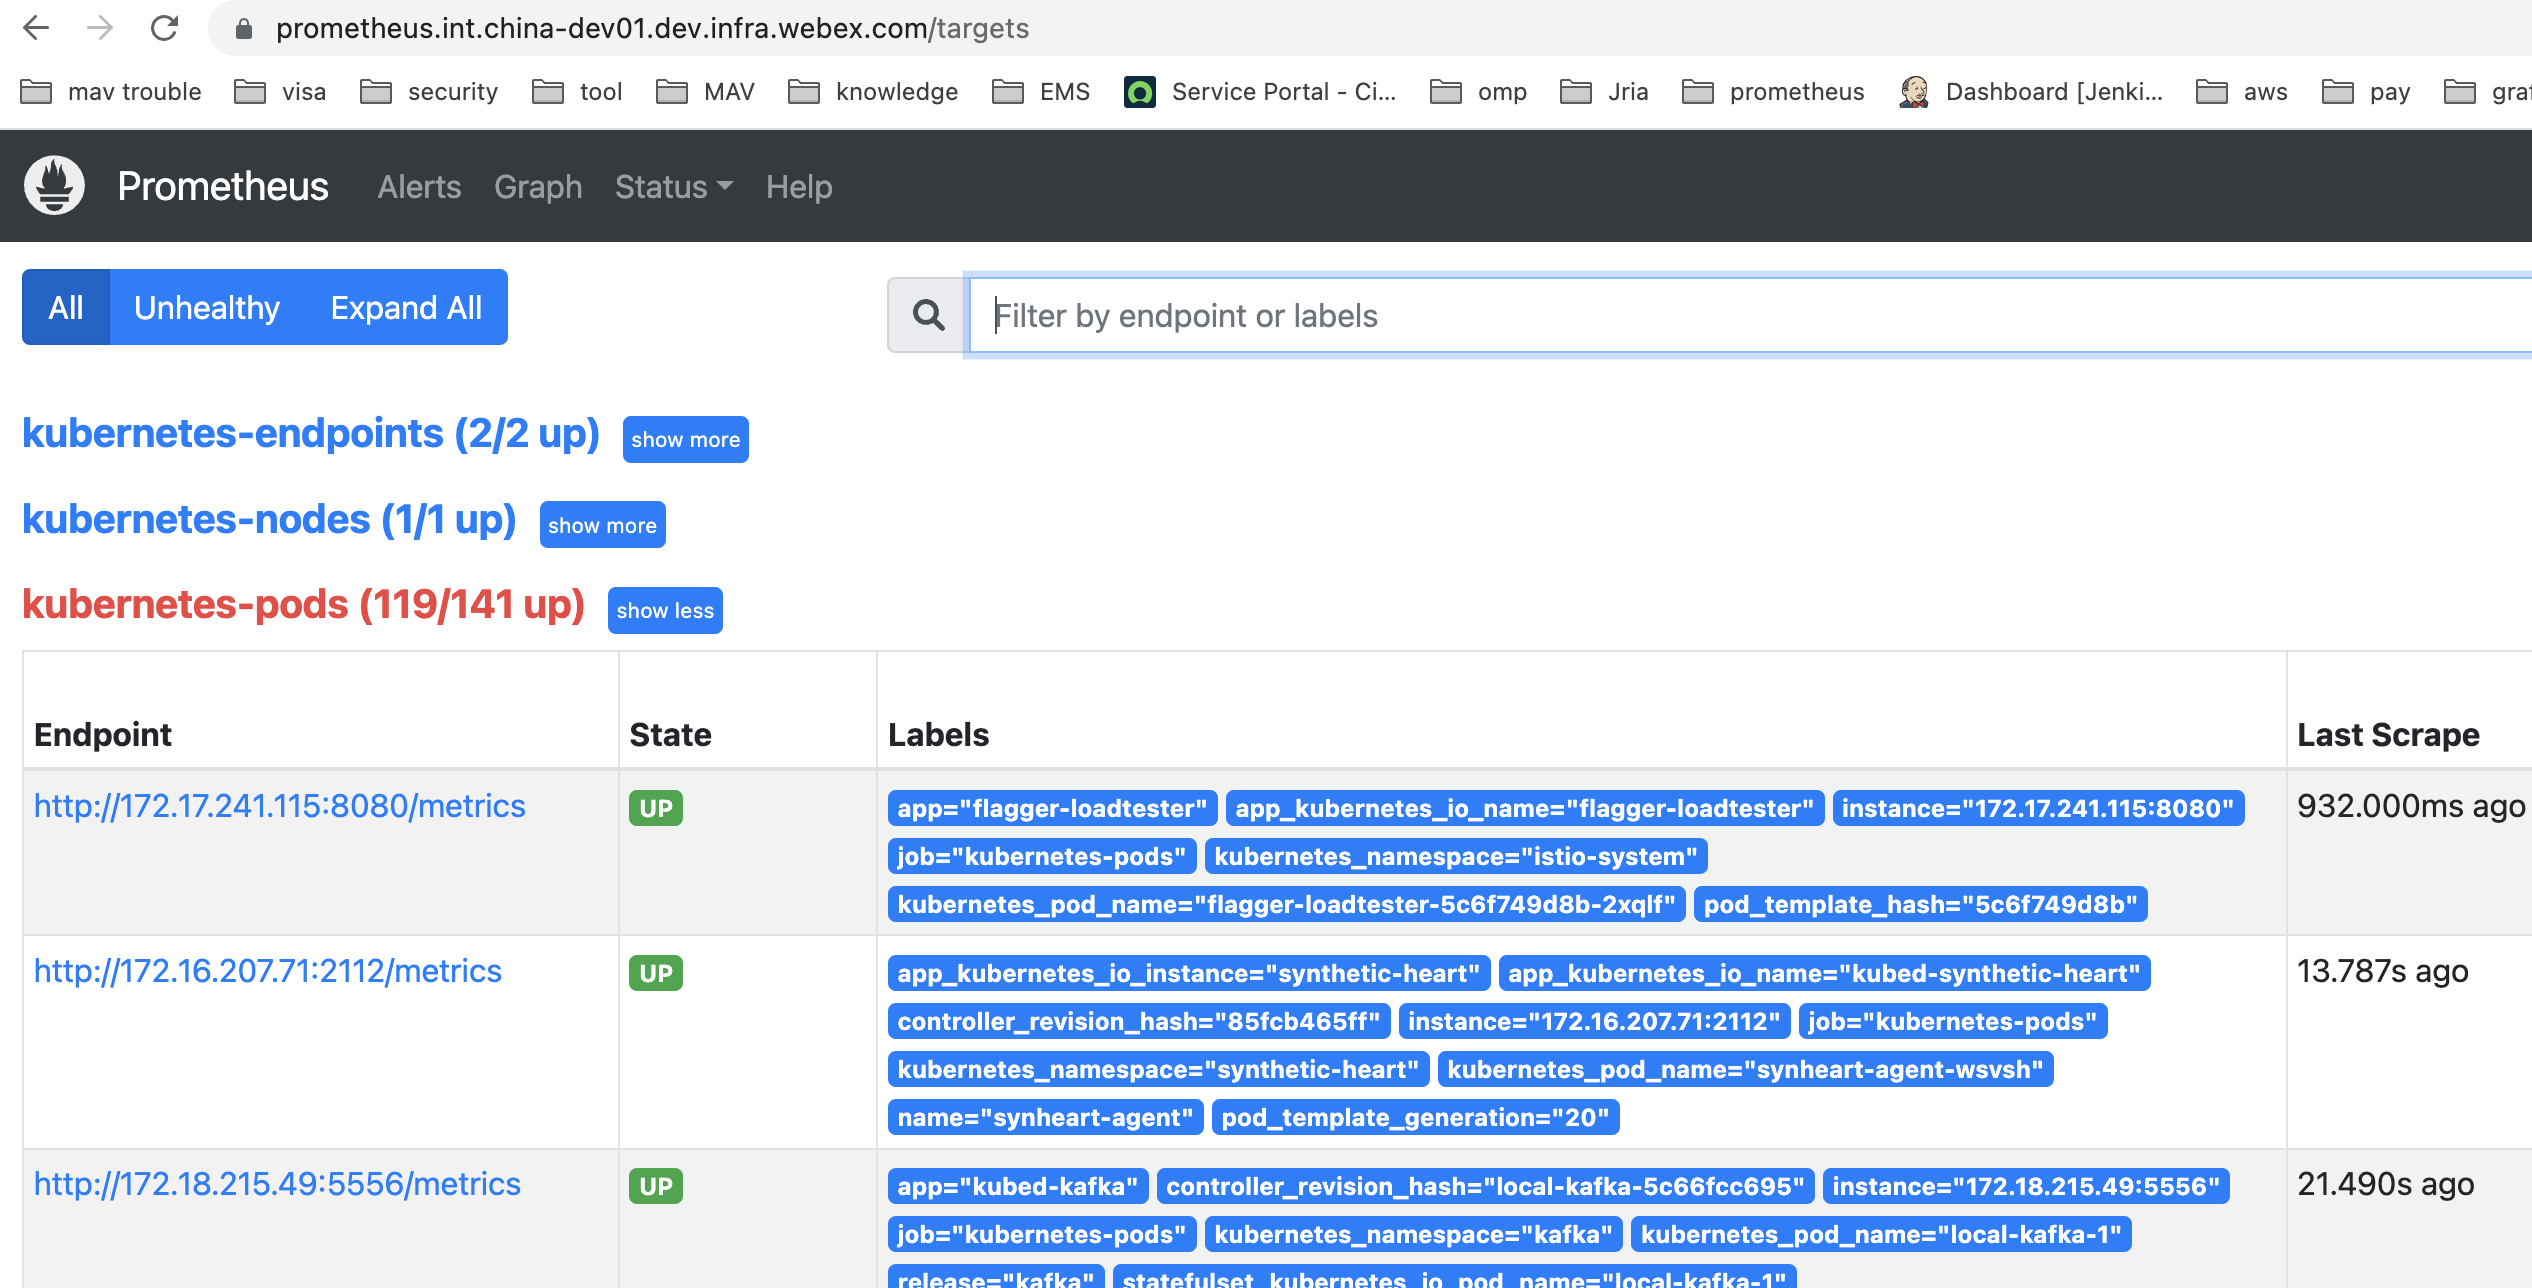
Application Metrics 
Application metrics expose by service owner, we response for discovery those app targets.
We use Prometheus self discovery function kubernetes_sd_config - pod.
Kubernetes SD configurations allow retrieving scrape targets from Kubernetes' REST API and always staying synchronized with the cluster state.
- We define target scrape job with values in Prometheus config:
- job_name: 'kubernetes-pods' kubernetes_sd_configs: - role: pod ### Prometheus look at all pods relabel_configs: - source_labels: [__meta_kubernetes_pod_annotation_prometheus_io_scrape] action: keep ### keep pods has annotations contains prometheus.io/scrape: 'true' regex: true - source_labels: [__meta_kubernetes_pod_annotation_prometheus_io_path] action: replace target_label: __metrics_path__ ### rename label name regex: (.+) - source_labels: [__address__, __meta_kubernetes_pod_annotation_prometheus_io_port] action: replace regex: ([^:]+)(?::\d+)?;(\d+) replacement: $1:$2 target_label: __address__ ### rename label name - action: labelmap regex: __meta_kubernetes_pod_label_(.+) - source_labels: [__meta_kubernetes_namespace] action: replace target_label: kubernetes_namespace - source_labels: [__meta_kubernetes_pod_name] action: replace target_label: kubernetes_pod_name - In app deployment(sample), add annotations like:
annotations: prometheus.io/scrape: 'true' prometheus.io/path: /metrics prometheus.io/port: '9102' - Prometheus will talk with Kubernetes API get all pods info and filter those pods contains Prometheus annotations and keep them as targets * Sample Targets