GSS Performance Test and Production Recover Playbook 
- Test Report * Case 1: 400 vUsers & 1 hour & 2 instances & Large DB * Case 2.1: 200 vUsers & 1 hour & 8 instances & Large DB
* Case 2.2: 200 vUsers & 1 hour & 8 instances & Redis
* Case 3.1: 400 vUsers & 1 hour & 8 instances & Large DB
* Case 3.2: 400 vUsers & 1 hour & 8 instances & Redis
* Case 4: 400 vUsers & 1 hour & 8 instances & xLarge DB
HA Background 
GSS frontend is deployed on cloudFront, it is worldwide CDN, and GSS backend is under Route53, the primary side is in Virginia us-east-1, the secondary side is in Ohio us-east-2.
Currently the secondary side is just a backup region, which means the data is not synced between Virginia and Ohio realtime.
Only everyday at 7:00am UTC, a job would copy the Virginia RDS instance snapshot to Ohio, and then RDS in the Ohio would be restored from this snapshot, followed by rebuilding the Ohio backend service with the latest webApp packages.
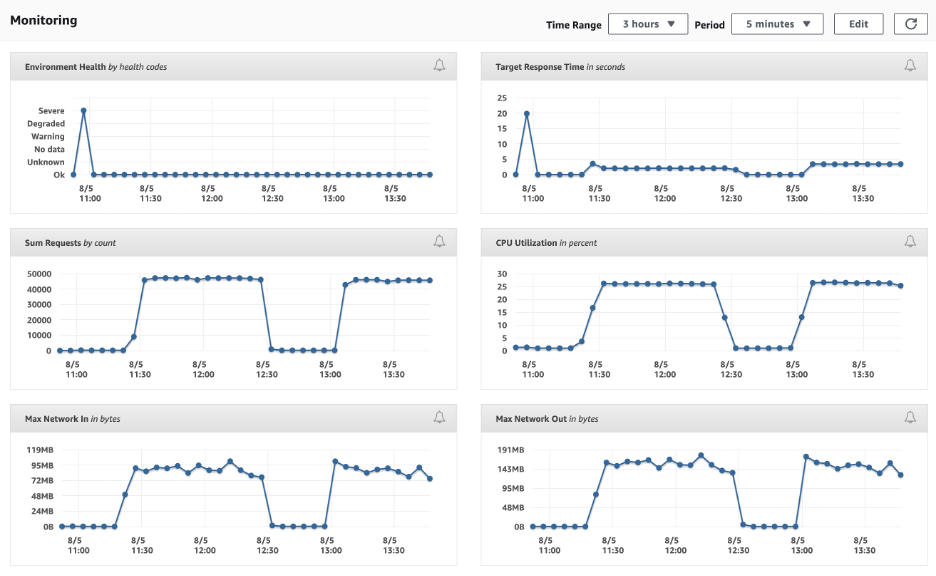
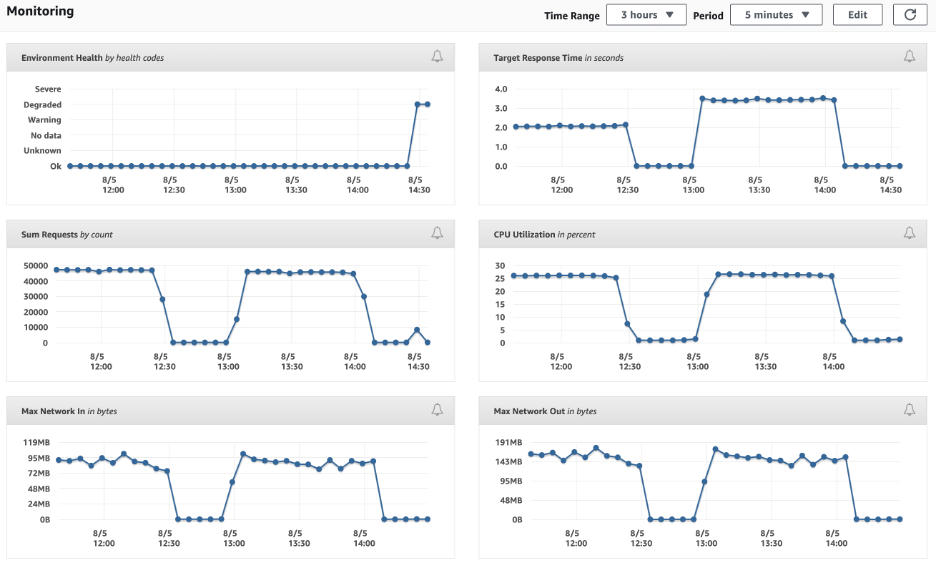
From the above graph, you can know that the backend service is bottle neck when a large amount of requests come to status page. So this playbook is written about how to handle GSS backend service issue.
Test Report 
We started a load test with the help of JMeter in dev environment for several cases. It help us know whether scale policy works well and what's the upper throughput of our system.
We got conclusion that DB instance need to be increased to xLarge class(4CPU,16G) , and 8 instances would be a better number than 2, so when requests coming to status page, no need to scale.
When we switch to the cache solution (cache the data of the three sub-pages of Service status|Incident history|Maintenance ), perform the load test again. It is found that throughput is much improved compared to fetching data from db. The test report for case2,case3,case5 is listed below for comparison. Cache node type: cache.m4.large(6G memory).
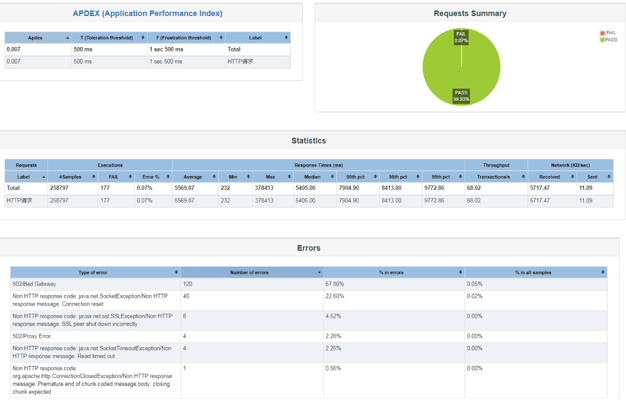
Case 1: 400 vUsers & 1 hour & 2 instances & Large DB 
Environment:
2 instances with RDS DB instance class(2CPU, 8G)
Result:
Concurrency : 400 vUsers Duration: 1 hour
Total Samples: 258797
Error Rate: 0.07%
Average Response Time: 5569.87ms
Throughput: 68.02
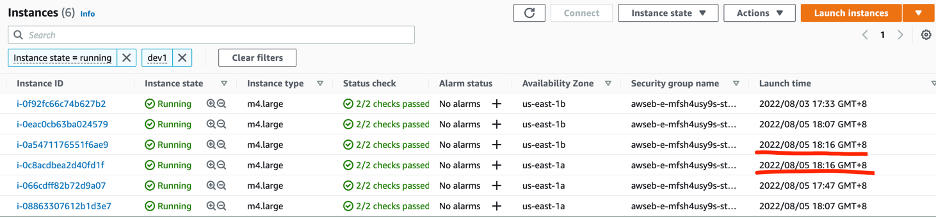
AWS auto scale up
Instances number started from 2 and the cpu utilization increased rapidly, which triggered the scale strategy. Then the Instances number increased to 4.

After adding two new instances, the cpu utilization decreased, but it was still too high, so EB continued to scale. Then the Instances number increased to 6. The cpu utilization gradually stabilized.
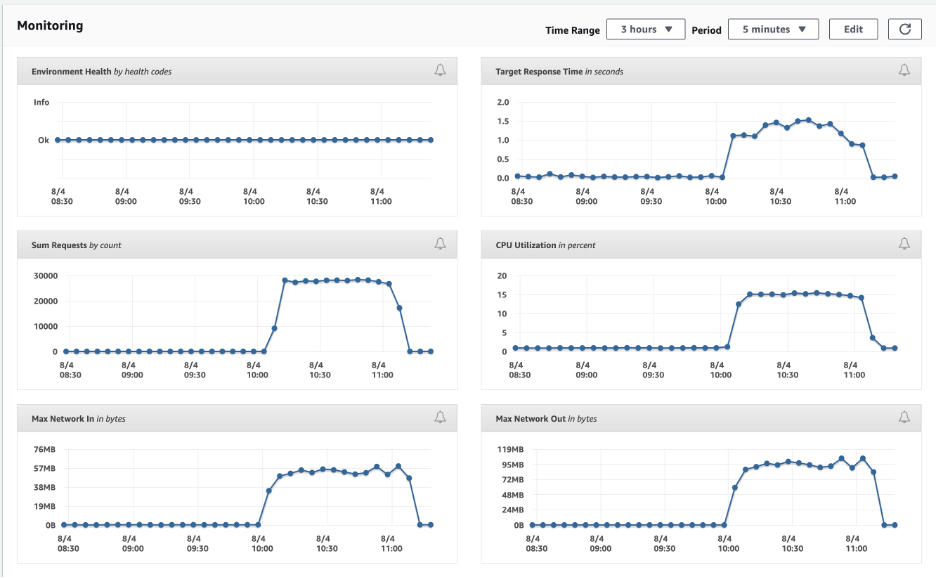
Case 2.1: 200 vUsers & 1 hour & 8 instances & Large DB 
Environment:
8 instances with RDS DB instance class(2CPU, 8G)
Result:
Concurrency : 200 vUsers Duration: 1 hour
Total Samples: 332263
Error Rate: 0%
Average Response Time: 2166.66 ms
Throughput: 92.20
AWS instance CPU Average: 15%
AWS no auto scale up 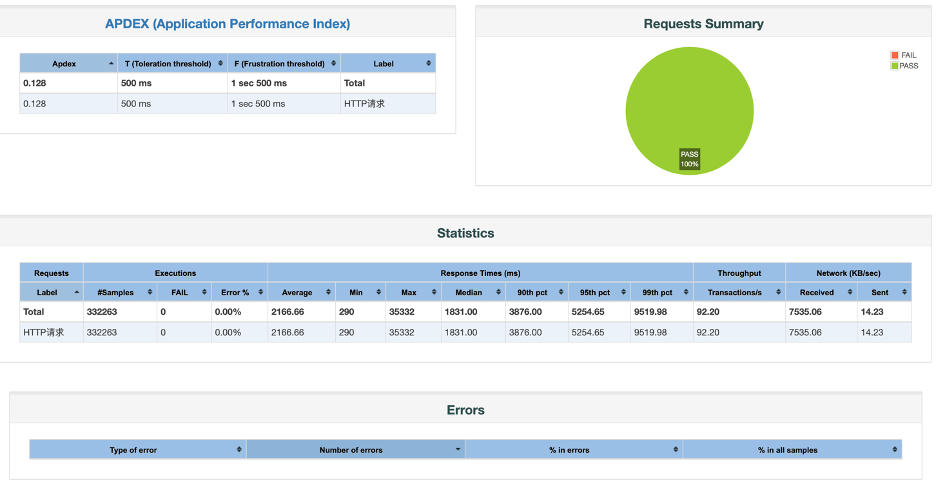
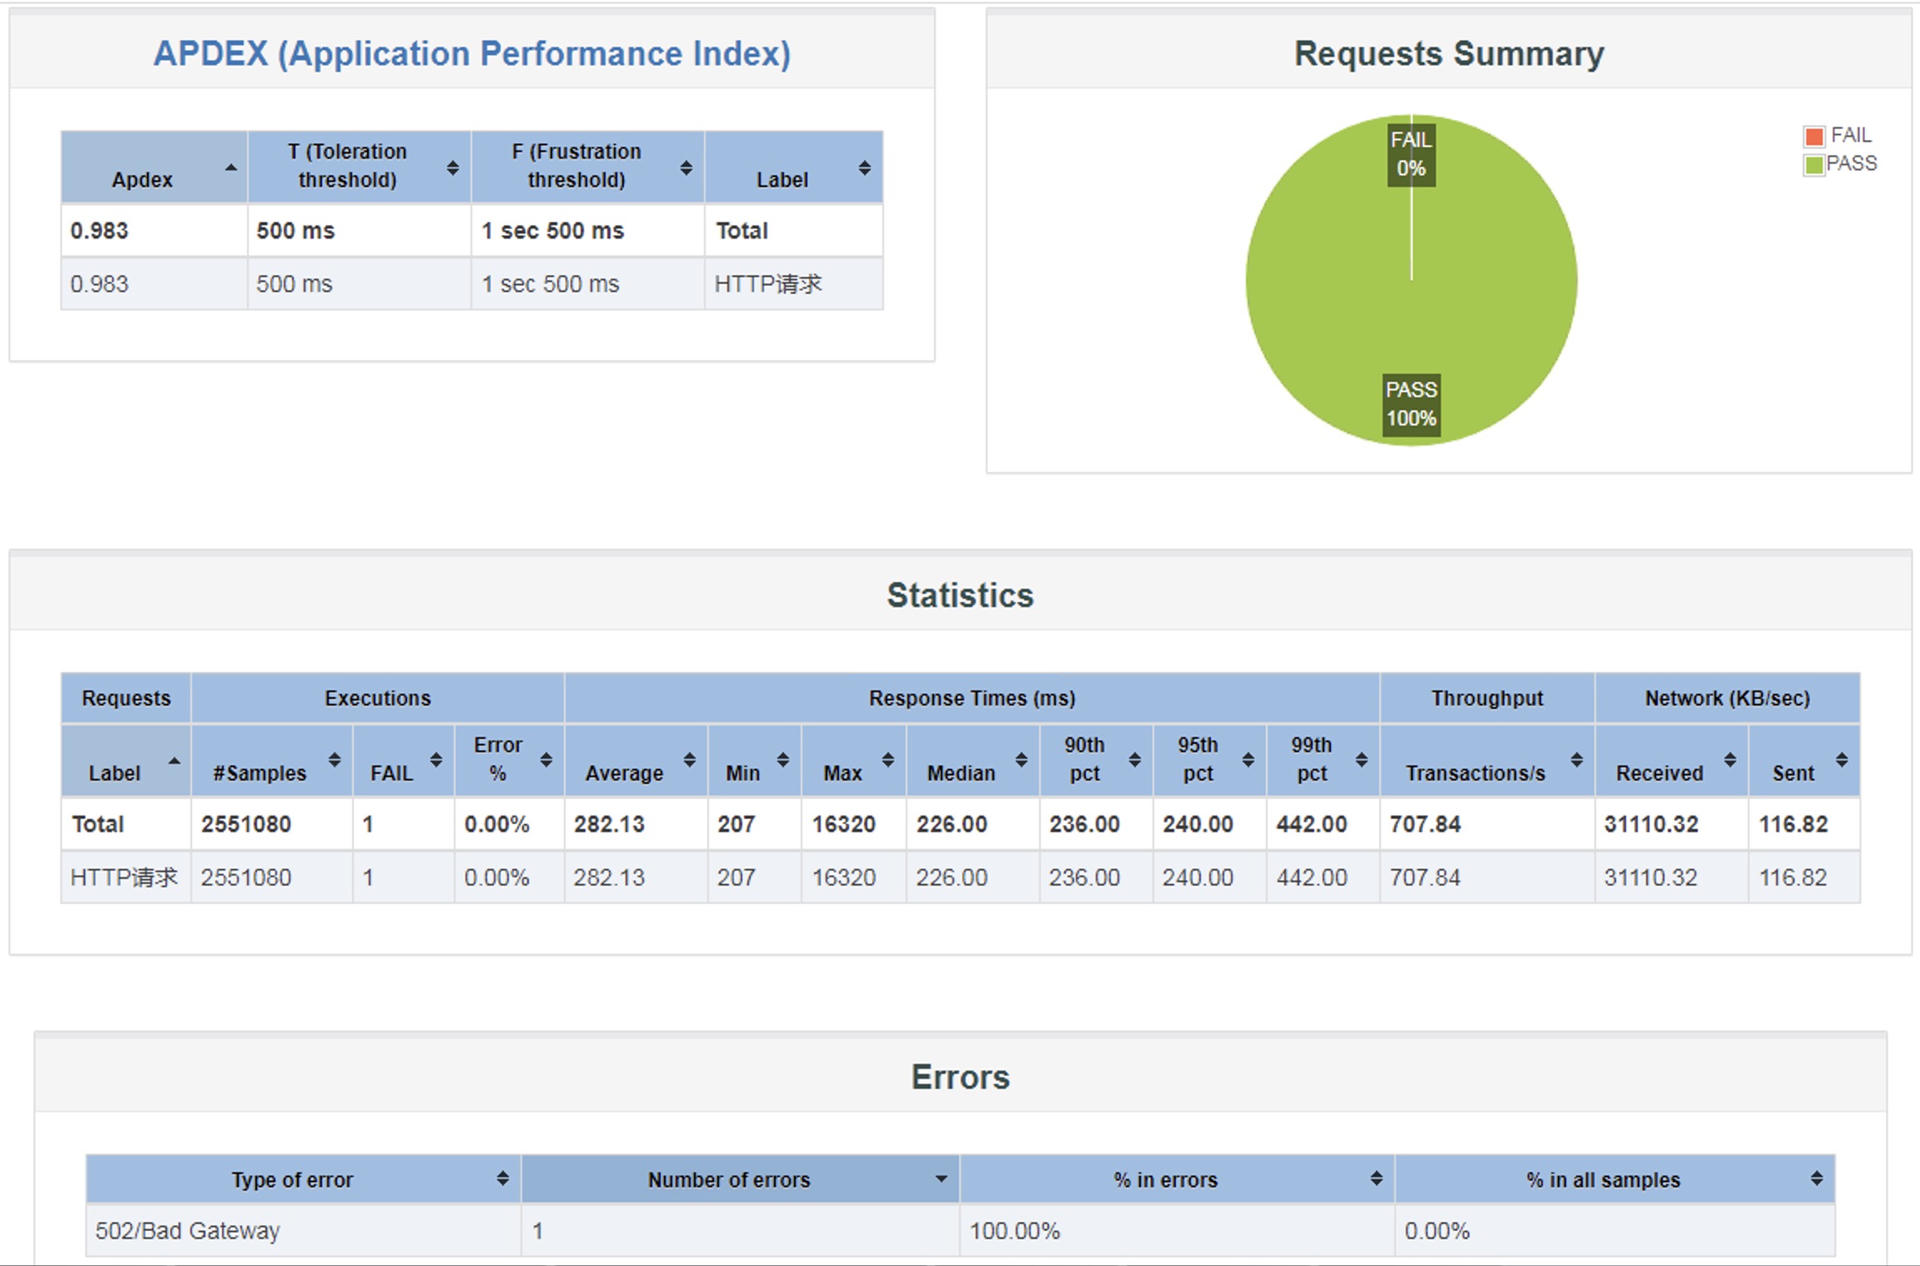
Case 2.2: 200 vUsers & 1 hour & 8 instances & Redis 
Environment:
8 instances with cache node type(cache.m4.large, 6G memory)
Result:
Concurrency : 200 vUsers Duration: 1 hour
Total Samples: 2551080
Error Rate: 0.00%
Average Response Time: 282.13ms
Throughput: 707.84
AWS instance CPU Average: 24%
AWS no auto scale up
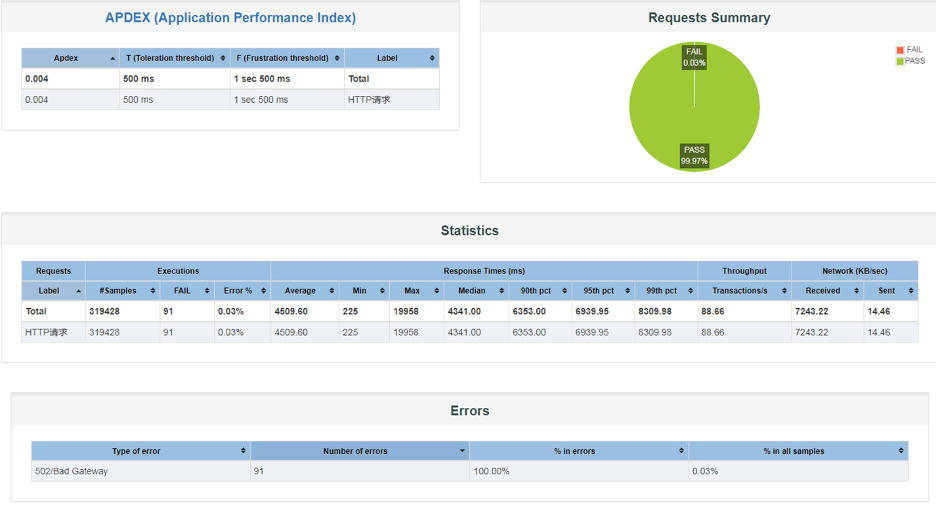
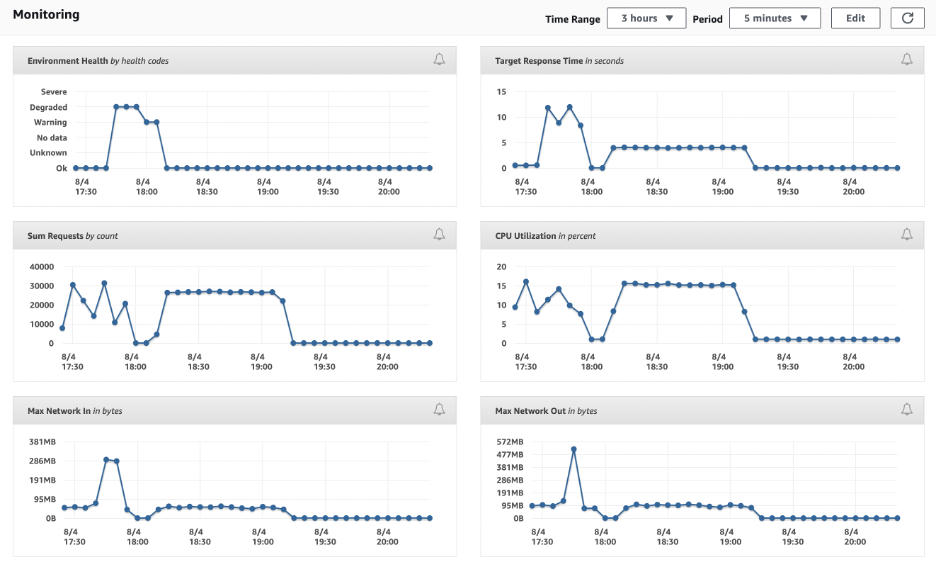
Case 3.1: 400 vUsers & 1 hour & 8 instances & Large DB 
Environment:
8 instances with RDS DB instance class(2CPU, 8G)
Result:
Concurrency : 400 vUsers Duration: 1 hour
Total Samples: 319428
Error Rate: 0.03%
Average Response Time: 4509.60ms
Throughput: 88.66
AWS instance CPU Average: 15%
AWS no scale up
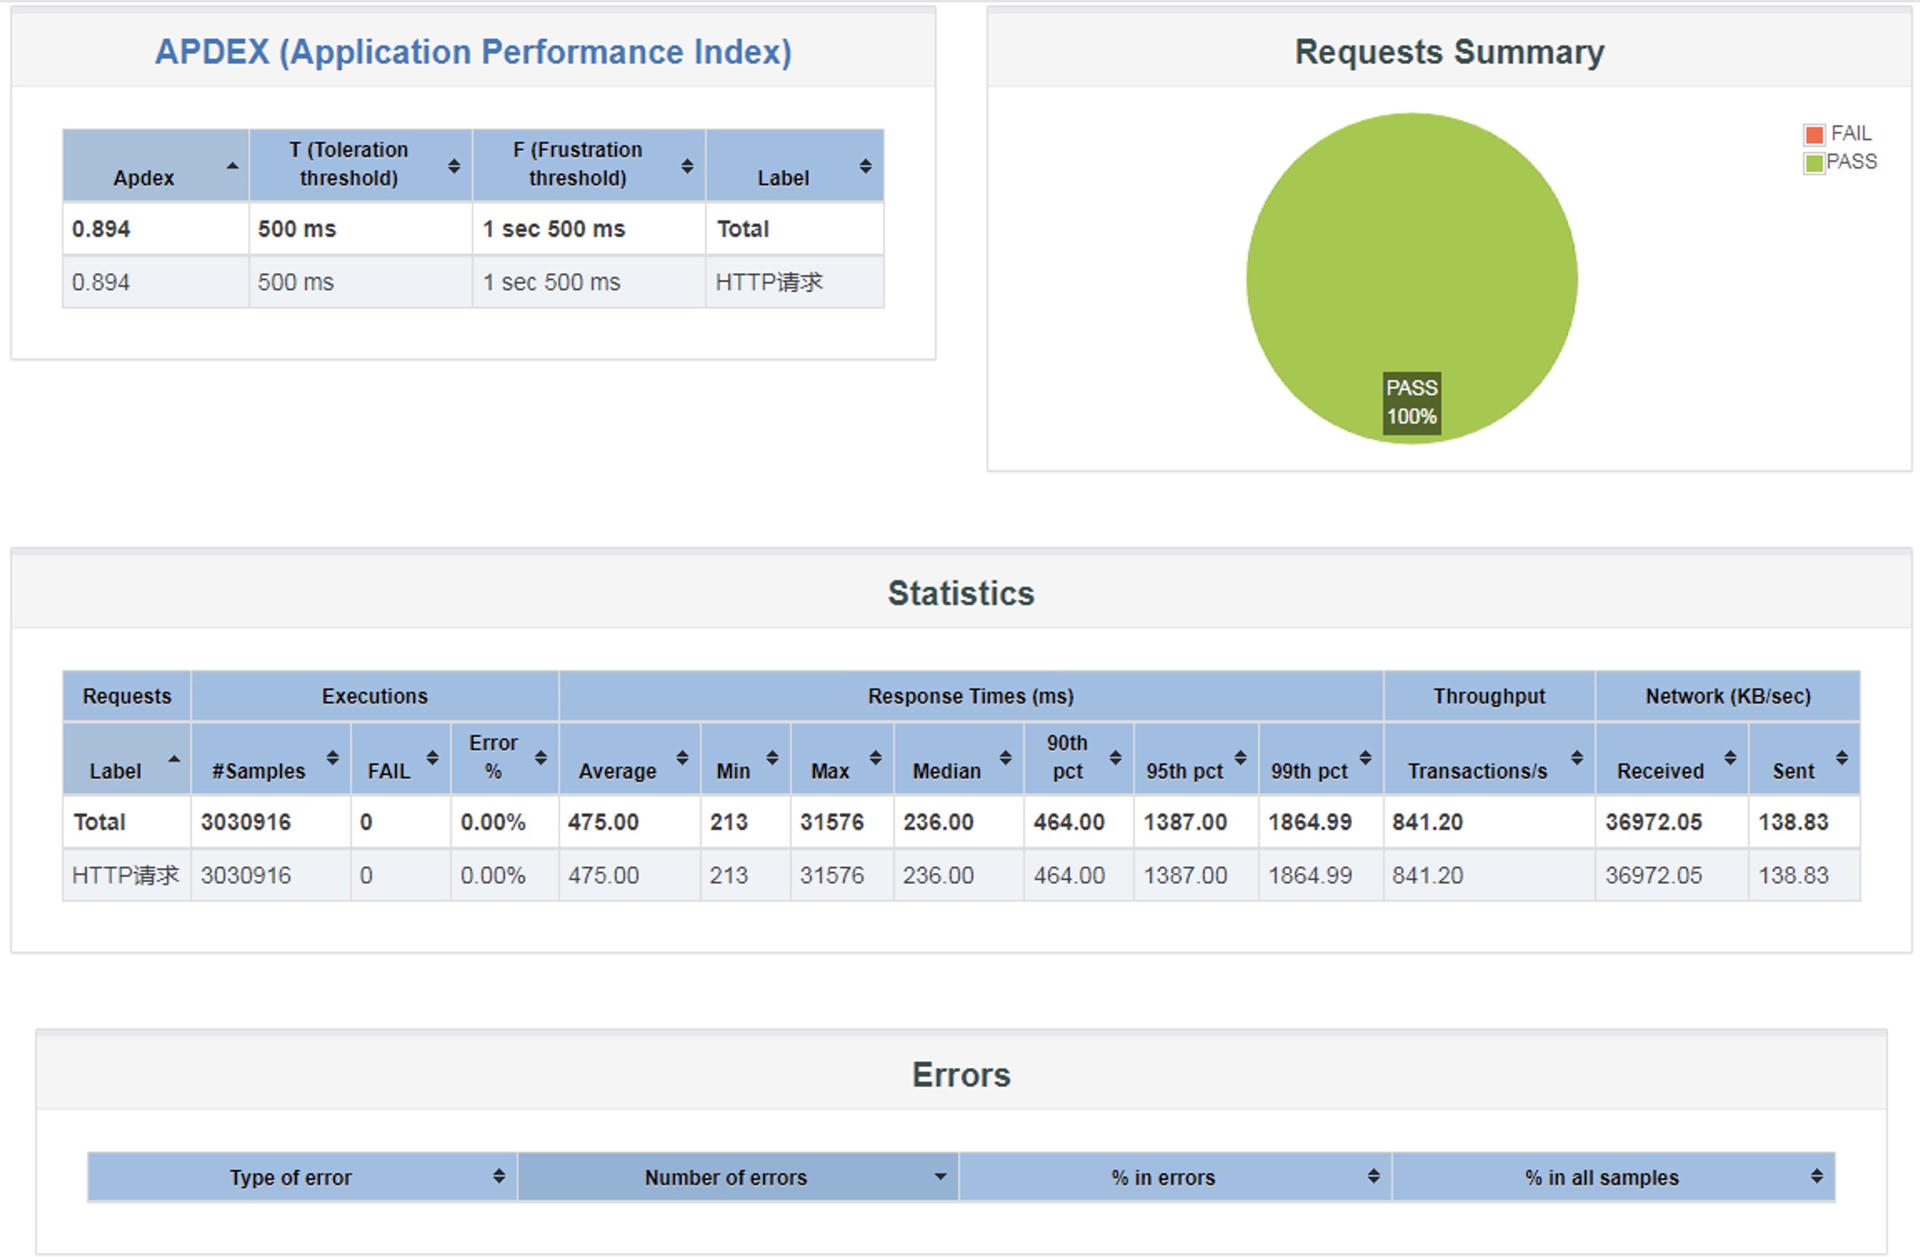
Case 3.2: 400 vUsers & 1 hour & 8 instances & Redis 
Environment:
8 instances with cache node type(cache.m4.large, 6G memory)
Result:
Concurrency : 400 vUsers Duration: 1 hour
Total Samples: 3030916
Error Rate: 0.00%
Average Response Time: 475ms
Throughput: 841.20
AWS instance CPU Average: 27%
AWS no auto scale up
Case 4: 400 vUsers & 1 hour & 8 instances & xLarge DB 
Environment:
8 instances with RDS DB instance class(4CPU,16G)
Result:
Concurrency : 400 vUsers Duration: 1 hour
Total Samples: 560727
Error Rate: 0.00%
Average Response Time: 2569.05ms
Throughput: 155.31
AWS instance CPU Average: 25%
AWS no scale up 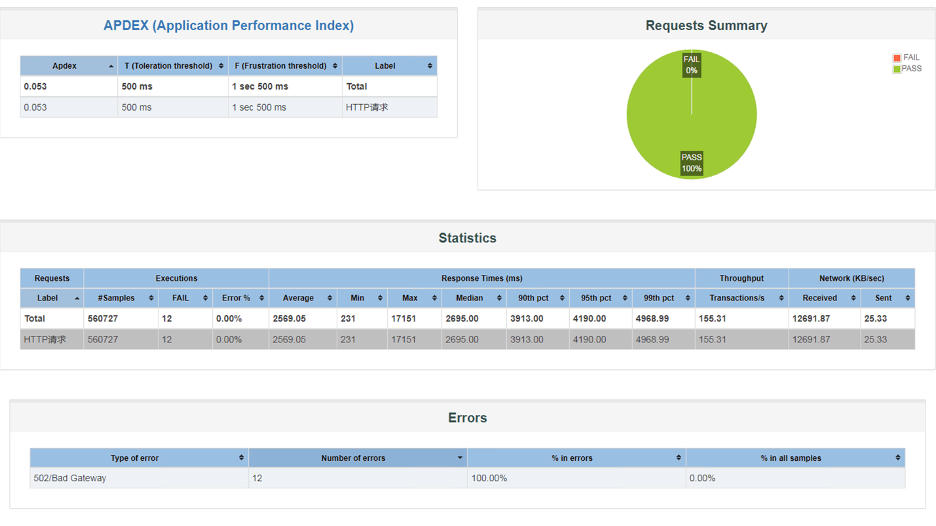
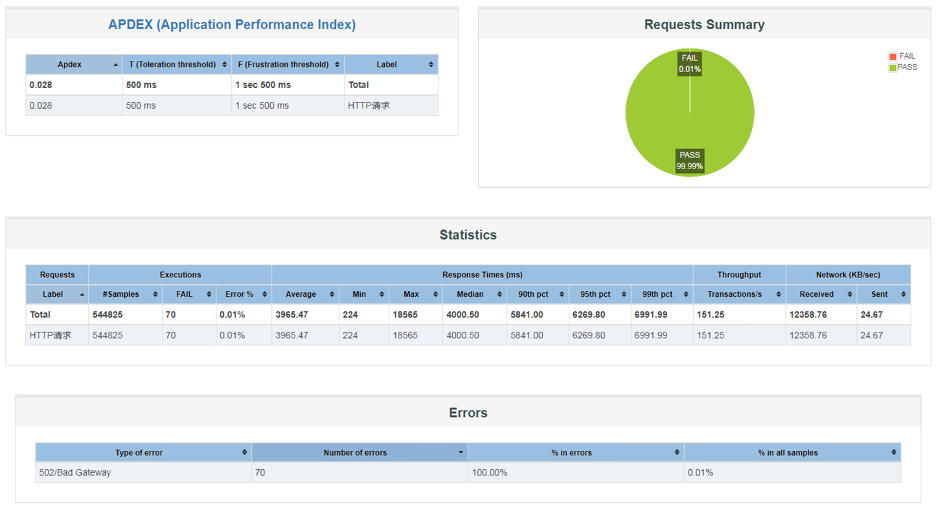
Case 5.1: 600 vUsers & 1 hour & 8 instances & xLarge DB 
8 instances with RDS DB instance class(4CPU,16G)
Result:
Concurrency : 600 vUsers Duration: 1 hour
Total Samples: 544825
Error Rate: 0.01%
Average Response Time: 3965.47ms
Throughput: 151.25
AWS instance CPU Average: 25%
AWS no scale up
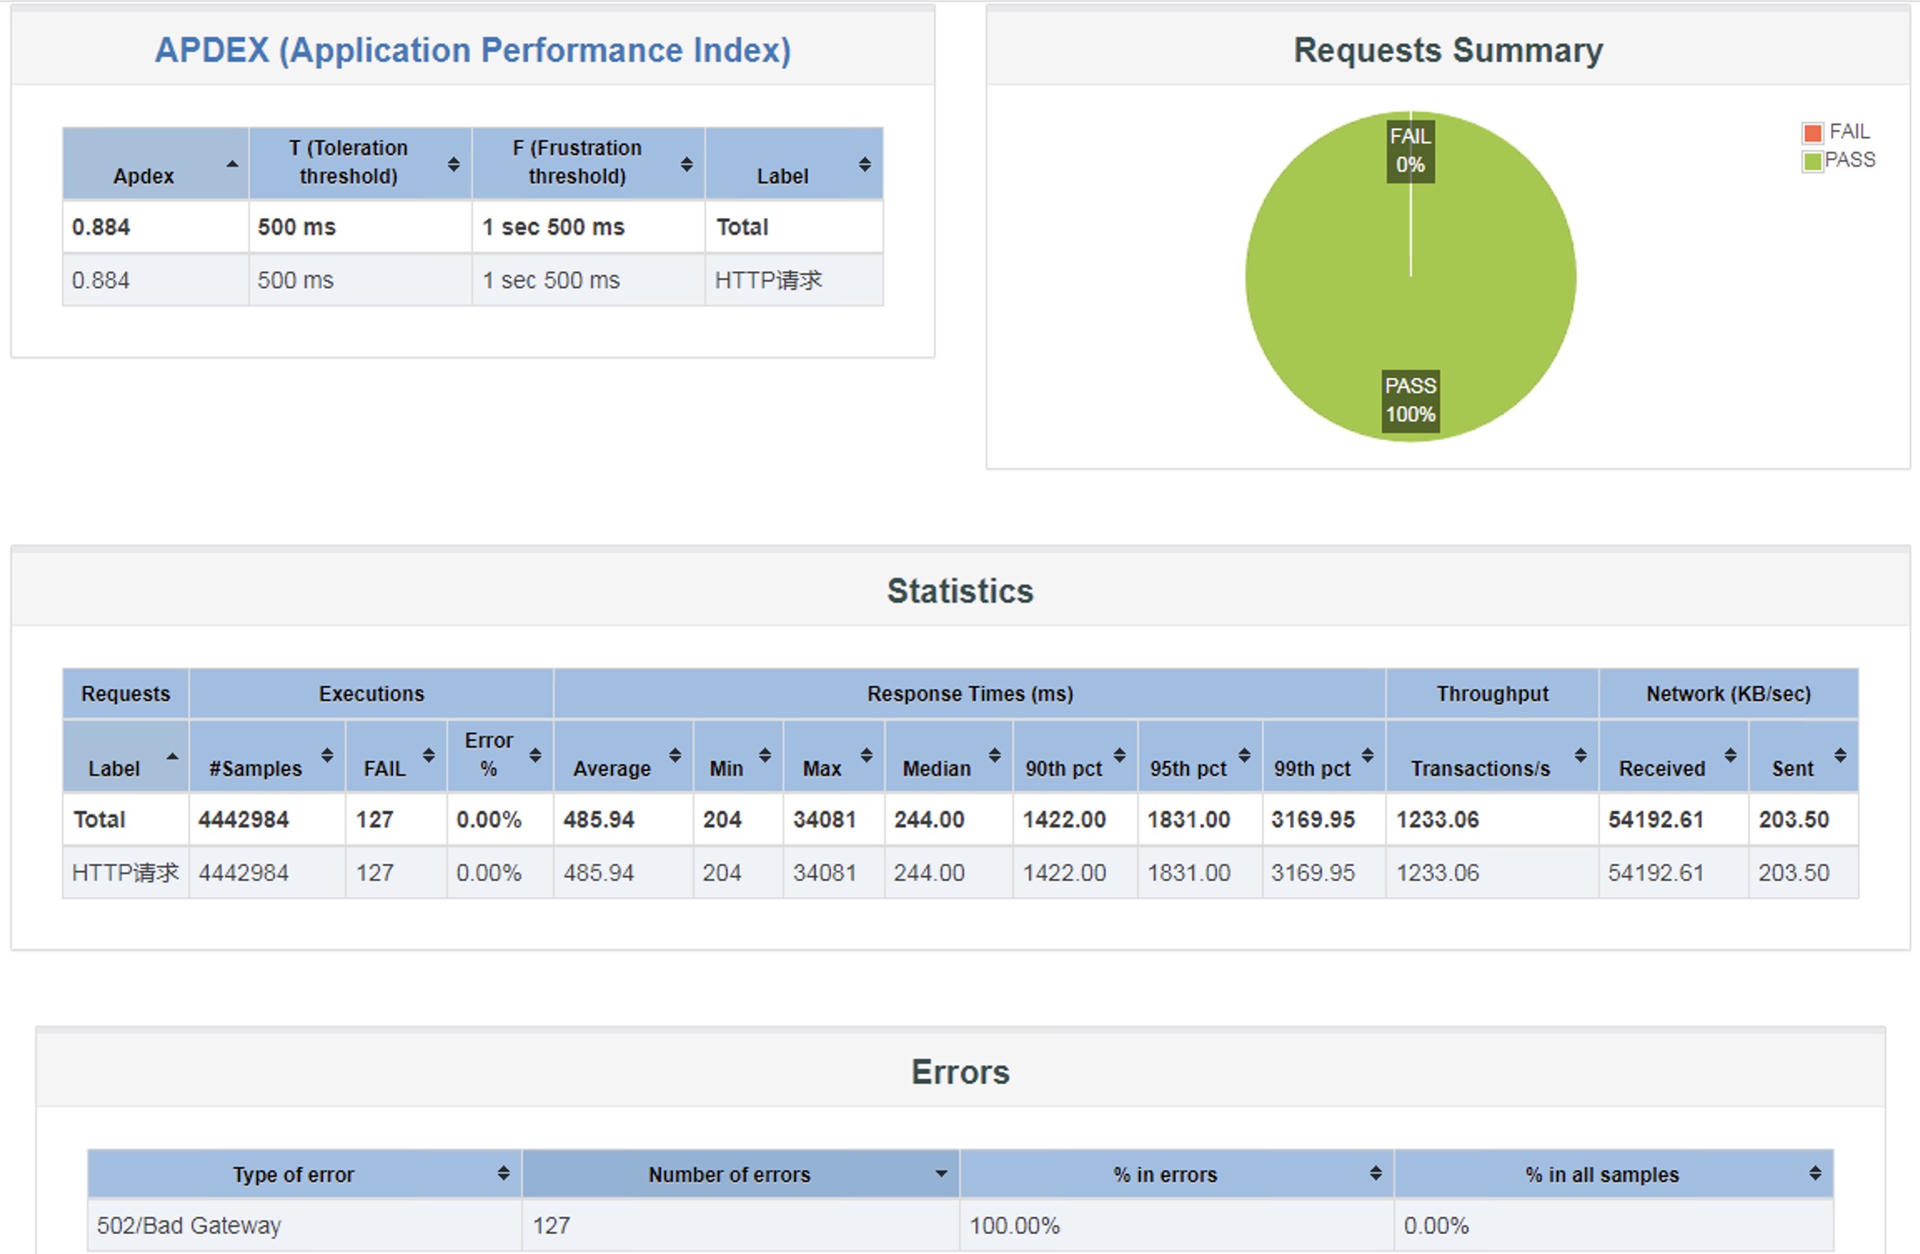
Case 5.2: 600 vUsers & 1 hour & 8 instances & Redis 
8 instances with cache node type(cache.m4.large, 6G memory)
Result:
Concurrency : 600 vUsers Duration: 1 hour
Total Samples: 4442984
Error Rate: 0.00%
Average Response Time: 485.94ms
Throughput: 1233.06
AWS instance CPU Average: 30%
AWS auto scale up to 14 instances
Recover Steps 
As we said, data sync from the Primary side to Secondary side has a delay for almost 1 day.
So If Route53 failovers to the Secondary side, you would see some data missing in portal. And if it is back to the Primary side, you would see data reappearing.
Remove unstable VIP from Route53 
We configured monitoring data on MCT: https://mct.webex.com/#status.jsp?clusterId=214816, it would test against GSS Route53 VIP, Primary ELB, Secondary VIP ELB.
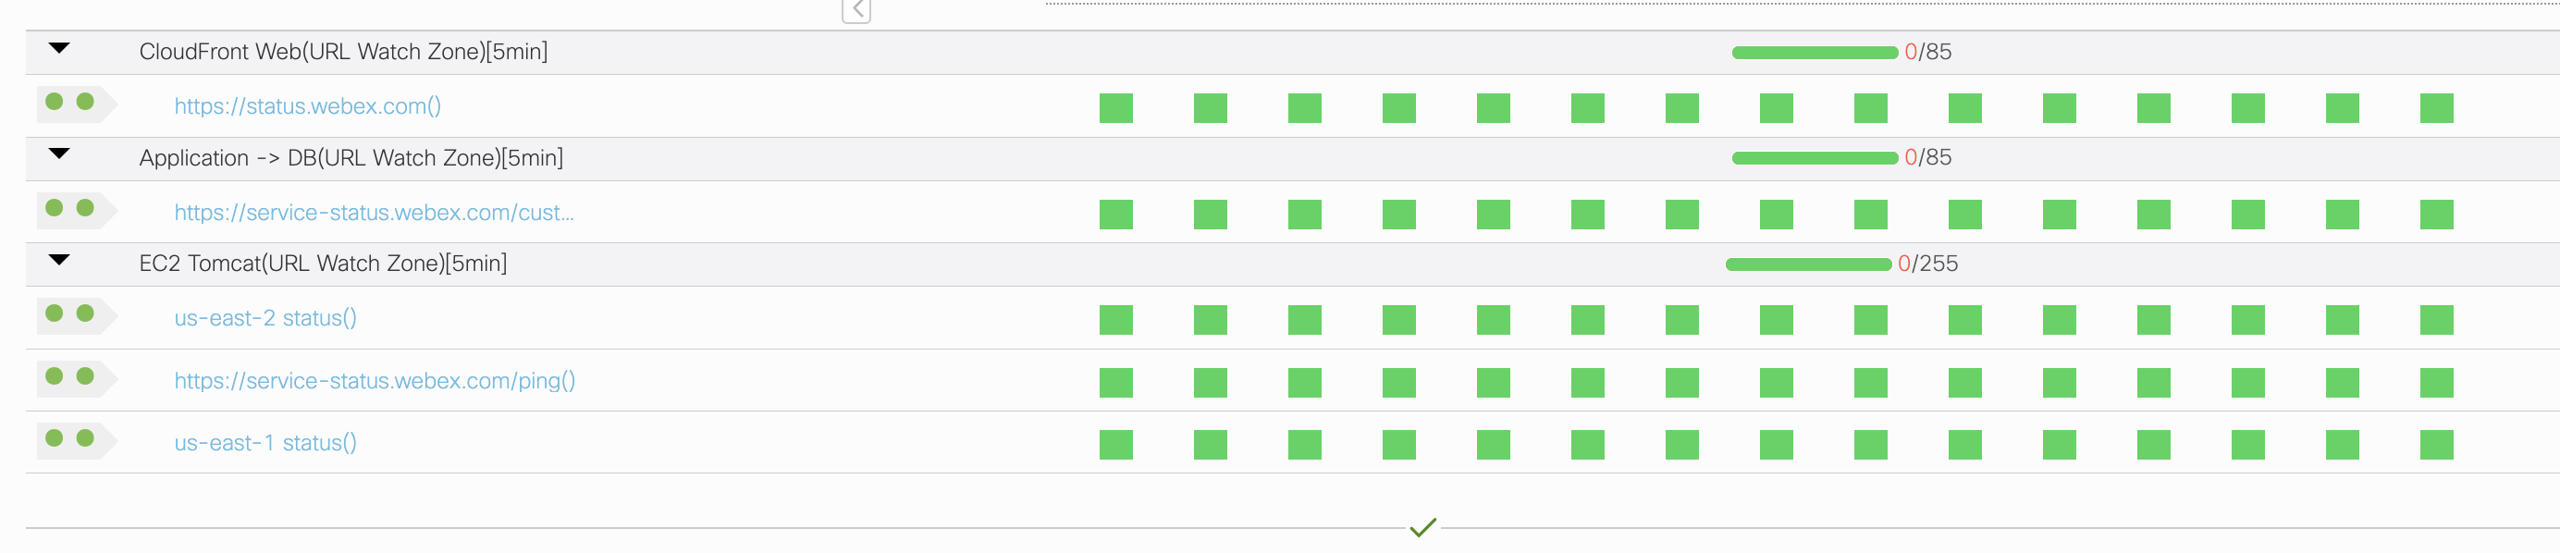
CloudFront Web checks the health for frontend, it should be always passing.
Application -> DB checks the main backend API for the customers page loading.
EC2-Tomcat checks the backend VIP:
us-east-2 is for the Ohio Region, it is Secondary side health check.
us-east-1 is for the Virginia Region, it is Primary side health check.
service-status.webex.com is for the Route53 health check.
Production Issue Case 1: Route53 failure 
Symptom: In MCT, Zone EC2-Tomcat or Application -> DB occurs intermittent failure, check of us-east-2 or us-east-1 is continuously failing for 3 points 
How to fix: 
- If Route53 health check or Application -> DB is intermittent failure, and us-east-2 or us-east-1 is continuously failing for 3 points, or you get the info that AWS has outages in Virginia or Ohio. you need to take actions
- Go to AWS with Cisco SSO https://cloudsso.cisco.com/idp/startSSO.ping?PartnerSpId=https://signin.aws.amazon.com/saml, then choose global-status-service (656663974684) admin account to login.
- Go to Route53 Health Check portal: https://us-east-1.console.aws.amazon.com/route53/healthchecks/home#/, you could get below health check status.

- Be aware that gss-service-secondary would be unHealthy for about 20 mins everyday between 7:40am-8:00am UTC. Apart from this, they should be always Healthy.
- If you find in MCT us-east-2 is continuously failing for 3 points and gss-service-secondary is unHealthy in AWS or AWS us-east-2 has an outage, click the gss-service-secondary health check, Edit health check, go to Advanced Configuration
- Or If you find in MCT us-east-1 is continuously failing for 3 points and gss-service-primary is unHealthy in AWS or AWS us-east-1 has an outage, click the gss-service-primary health check, Edit health check, go to Advanced Configuration
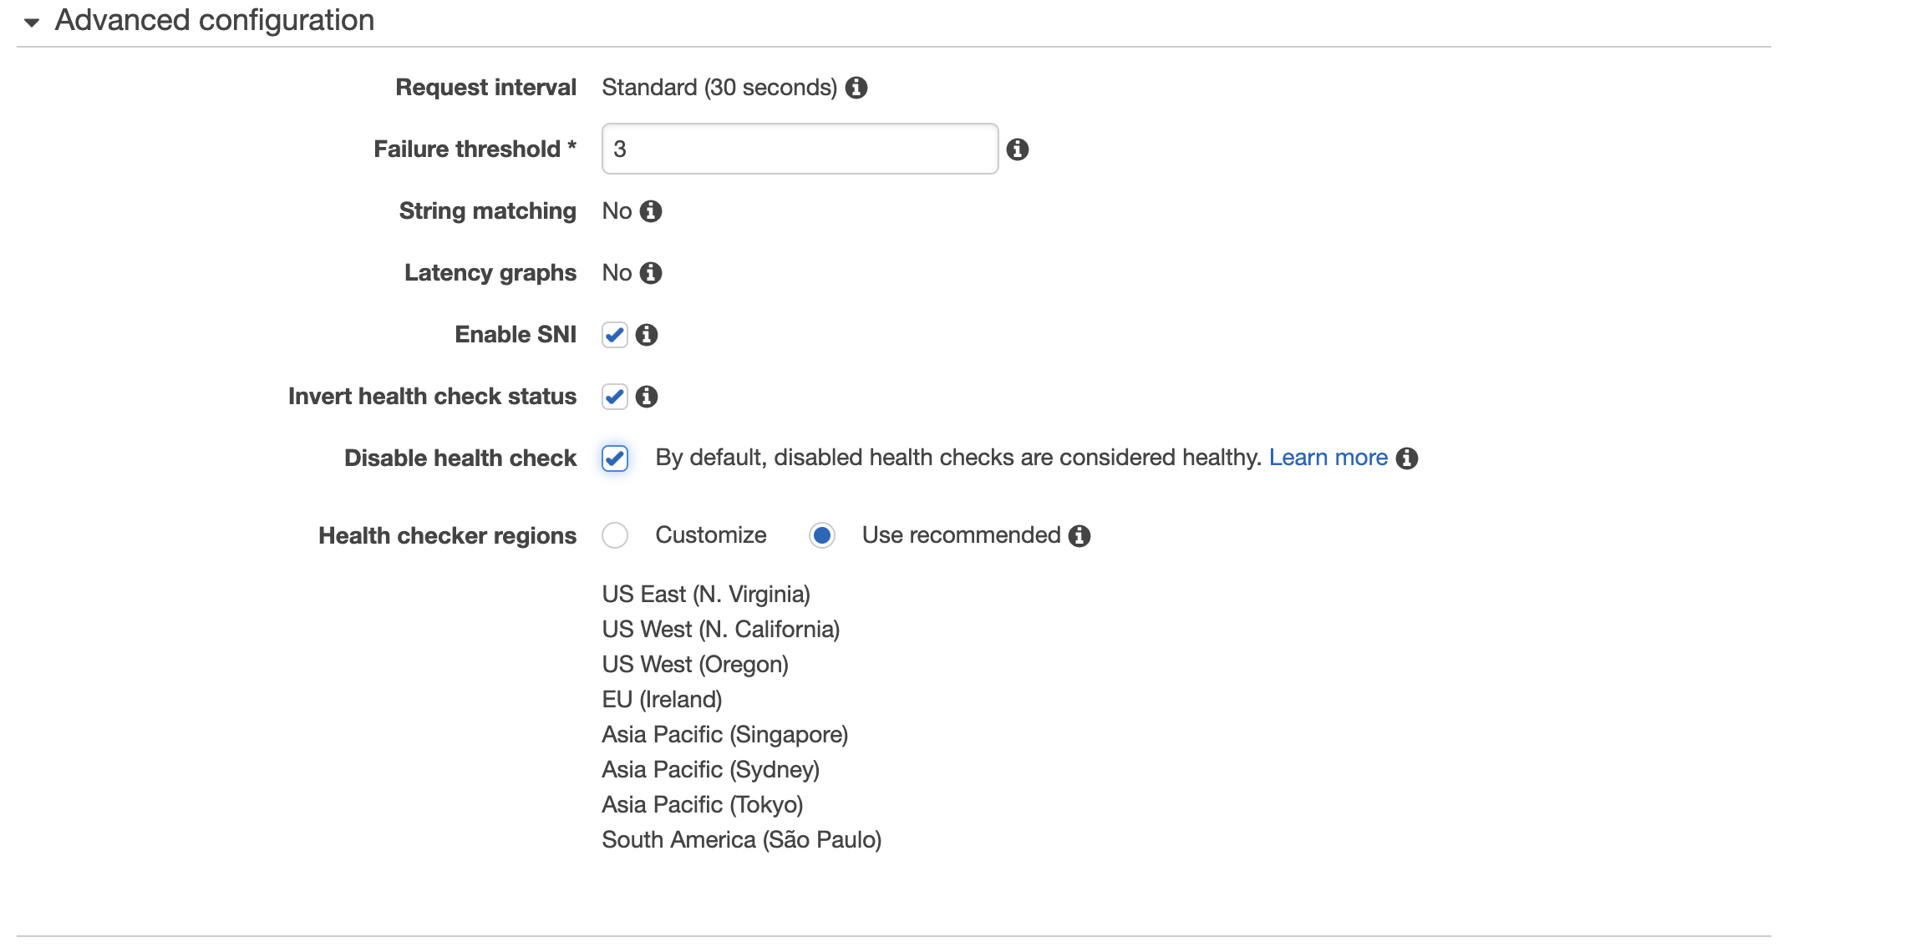
- Checked both Disable health check and Invert health check status, after checked, the health check of gss-service-primary or gss-service-secondary would be always unHealthy.
- If the health check of primary or secondary is always unHealthy, Route53 would not route any traffic to the corresponding region.
- Once back to normal, unchecked both Disable health check and Invert health check status.
Fill missing data in the secondary Region 
If you don't want to solve this issue by removing unstable VIP from Route53, you can fill missing data in the secondary Region, so you won't see any data missing and reappearing.
- Go to Primary portal https://us-east-1.globalservicestatus.com/service/status?lang=en_US, it is connected to us-east-1 Primary VIP https://service-status-us-east-1.webex.com/ping
- Go to Secondary portal https://us-east-1.globalservicestatus.com/service/status?lang=en_US, it is connected to us-east-2 Secondary VIP https://service-status-us-east-2.webex.com/ping
- You can add the missing data in Secondary portal.
- Remember that the data added to Secondary portal would be overridden after the daily restore. You may need to add the new data, if there is a gap between the Primary and the Secondary again.
Restart Applications for every Region 
If you find 3 continuous failures for us-east-2 in MCT and gss-service-secondary is unHealthy in AWS or AWS us-east-2 has an outage, you can restart us-east-2 services.
If you find 3 continuous failures for us-east-1 in MCT and gss-service-primary is unHealthy in AWS or AWS us-east-1 has an outage, you can restart us-east-1 services.
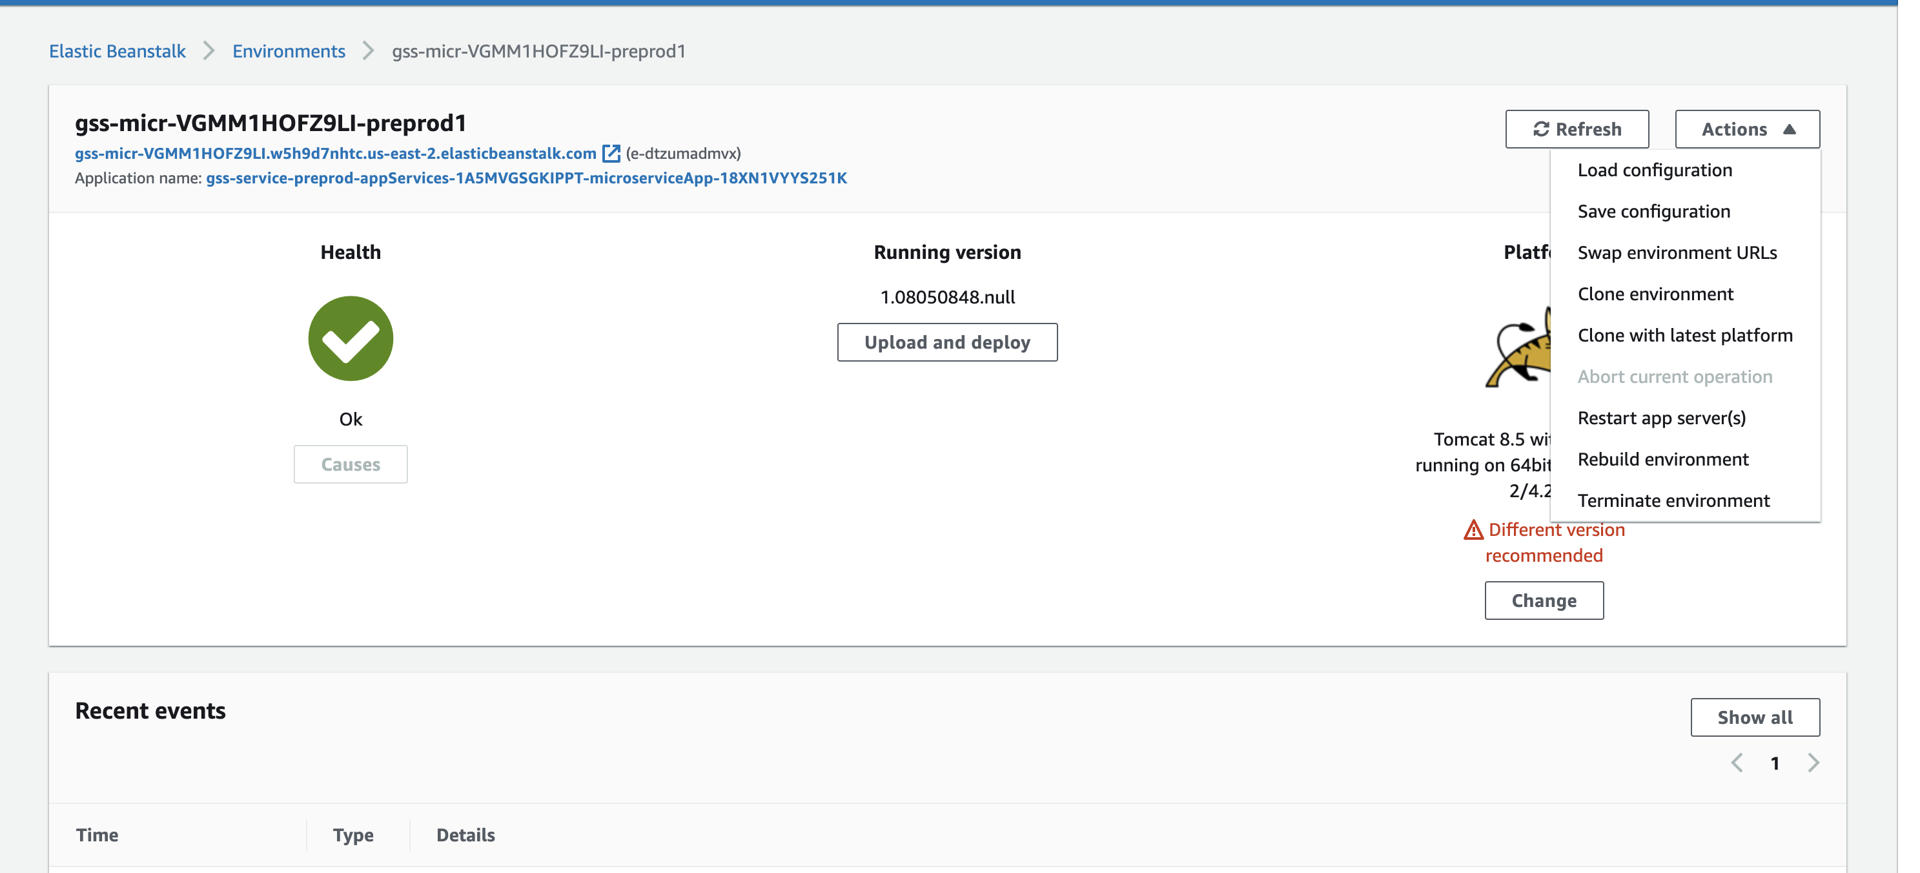
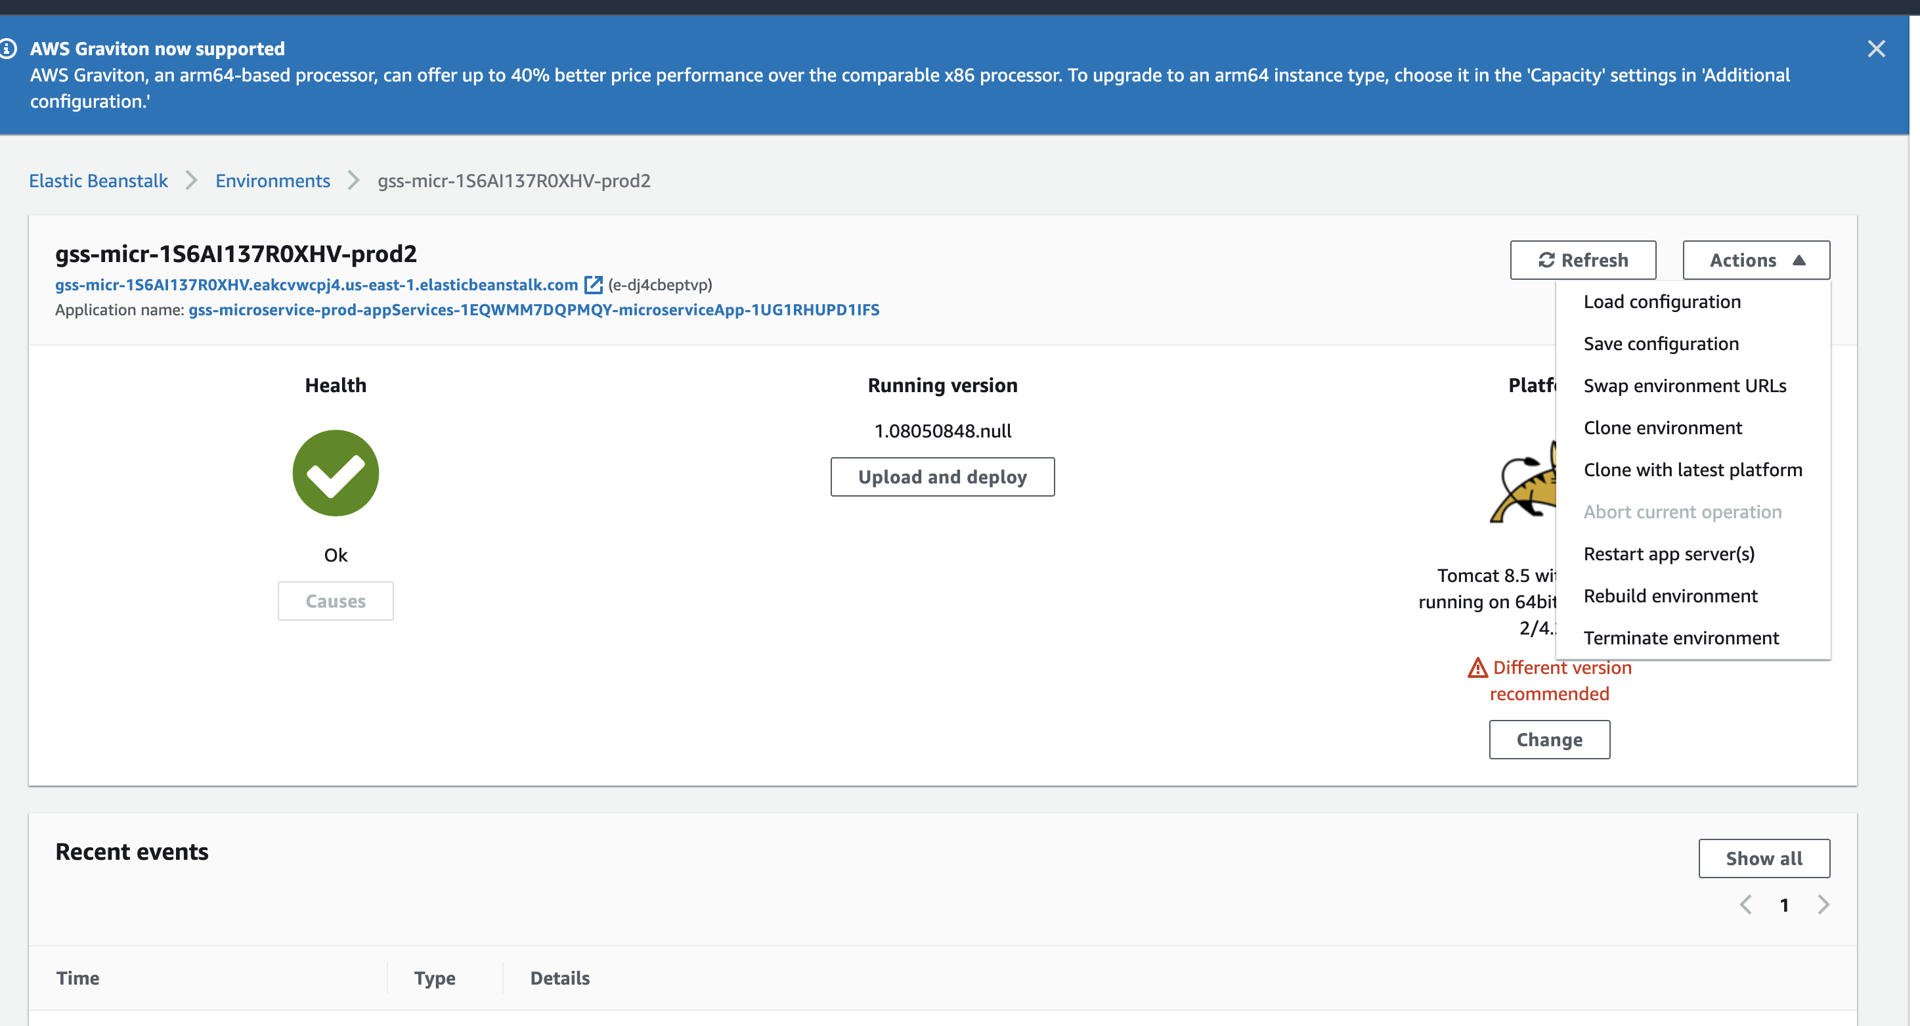
- Restart us-east-1 services: Go to the link https://us-east-1.console.aws.amazon.com/elasticbeanstalk/home?region=us-east-1#/environment/dashboard?applicationName=gss-microservice-prod-appServices-1EQWMM7DQPMQY-microserviceApp-1UG1RHUPD1IFS&environmentId=e-dj4cbeptvp and click Actions -> Restart app server(s). Then just wait for servers are restarted.
-
Restart us-east-2 services: Go to the link https://us-east-2.console.aws.amazon.com/elasticbeanstalk/home?region=us-east-2#/environment/dashboard?applicationName=gss-service-preprod-appServices-1A5MVGSGKIPPT-microserviceApp-18XN1VYYS251K&environmentId=e-dtzumadmvx and click Actions -> Restart app server(s). Then just wait for servers are restarted.