Get Started
Introduction 
The Internal Service Status project aims to centralize and provide a comprehensive view of the health of our products/services for internal stakeholders. This initiative addresses the need for a single source of truth for status information, enabling proactive issue resolution and faster response times.
Internal Service Status aggregates data from multiple monitoring tools into a single dashboard, offering real-time insights into our technical ecosystem. The dashboard provides both high-level (Core Feature View) of system health, allowing users to focus on specific issues or monitor overall service performance.
How to Onboard 
ISS defines a set of core features. The initial version contains two parts: core features list for the Webex product and core features list for the platform. The comprehensive list of Webex products and platform features is now defined within Backstage. This Domain encompasses all Webex products as well as the Webex platform. Core feature list for Domain cames from Webex Status, and the core service for Webex Platform comes from Backstage/Webex-Kubed-Domain
Currently, the list of core features is stored in the git repository internal service status, and data are in sync with Backstage.
Configuration as code 
Taking the platform as an example, it is defined in the file internal-service-status/platform-domain/manifest.yaml.
position: 0
alias: Platform
core-feature:
- name: Monitoring as a Service
  matchers:
  - status_fid = 4b328135-015f-4812-9950-335623362479
  monitoring_tools:
  - name = Thousandeyes
  - name = Kibana
- name: Service Mesh
  matchers:
  - status_fid = eee94718-57aa-4fdc-878d-41e134ae33a8
- name: Certificate Management
  matchers:
  - status_fid = f3167337-9926-4608-8df4-90528cbecdf3
  monitoring_tools:
  - name = Alertmanager
- name: DNS
  matchers:
  - status_fid = c7c7b410-974f-4a26-92d0-9e6407802c0d
  monitoring_tools:
  - name = Thousandeyes
  - name = MCT
After defining them, the service and core features will automatically be displayed on the ISS portal.
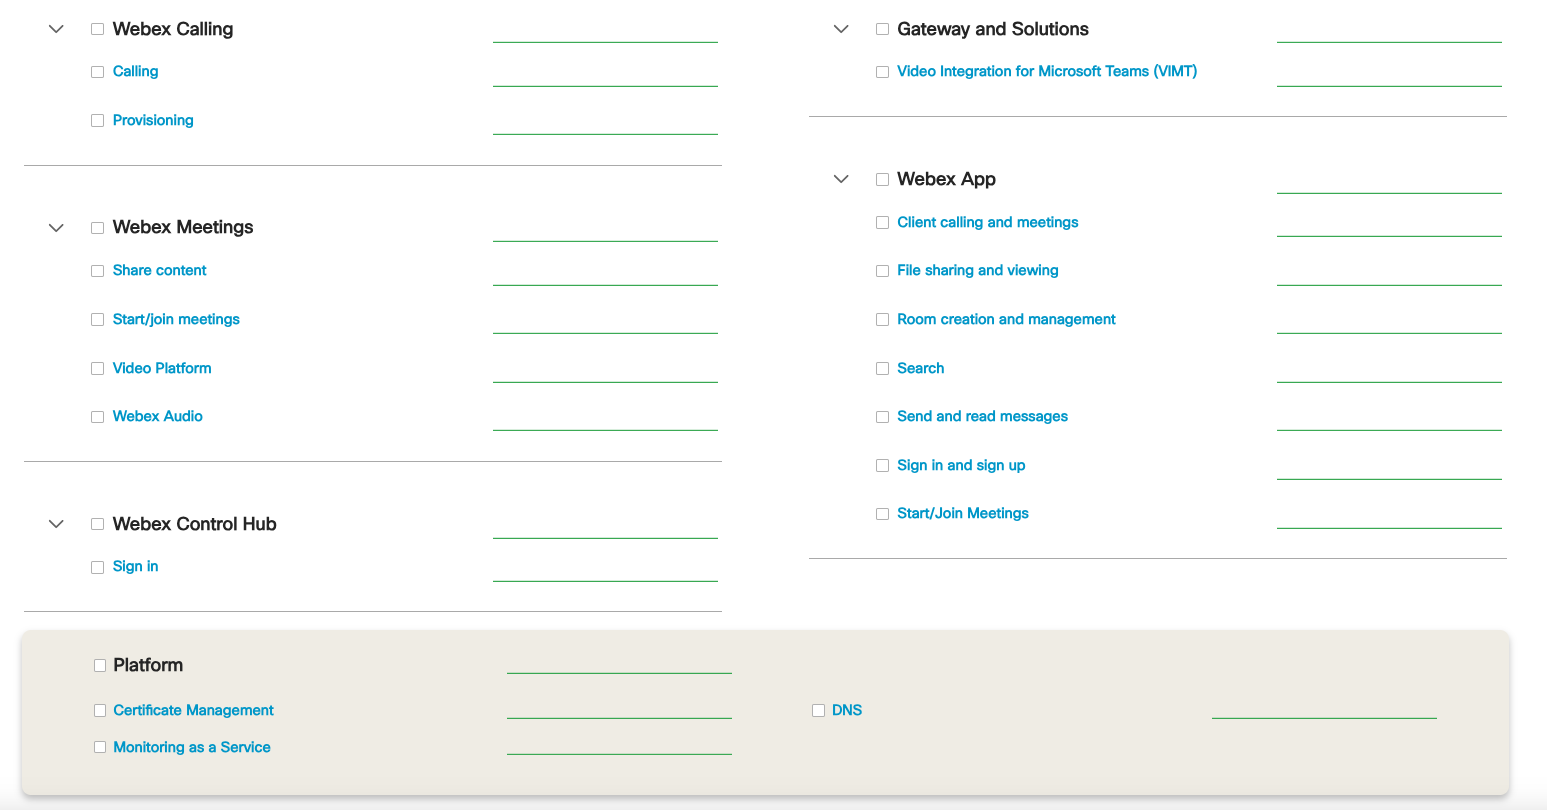
Status data within the ISS is derived from alerts generated by various monitoring tools. Consequently, if a monitoring tool is connected but no alerts are received, the status will display as 'Pass' (indicated in green). Conversely, any received alerts will be reflected on the portal, either in red (sourced from Apdex) or yellow (originating from the internal monitoring tool). To ensure that critical alerts are directed into the ISS, it is necessary to configure the ISS collector URL as an alert notification webhook.
Next, there are two methods to correlate alerts with core features. One method is to send it with the parameter status_fid = f3167337-9926-4608-8df4-90528cbecdf3. The other method is to use key pairs: coreService = Platform and coreFeature = Certificate Management. For coreService, it refers to alias, and for coreFeature, it refers to name in the file, or you can copy them from the ISS portal.
Once properly configured, these alerts will be displayed on the ISS in a timeseries-based manner.
NOTE: As core feature statuses will be displayed by geolocations, alerts sent to ISS should be labeled with dataCenter and cluster.
Deploy 
LMA - Grafana 
ISS collector URL: ${ISS_HOST}/collector/event/v1/grafana
The LMA Grafana alert rules are currently defined in the Git repository wbxlma/metrics-grafana-alerts-prd-commercial. There are two types of alert rules, for more information on alerting rules, you can refer to the Grafana documentation:
- Grafana Managed Alerts: These can be found in the directory grafana_managed_alert.
- Loki or Mimir Alerts: These can be found in the directory loki_or_mimir_alert.
For example, if you want to define alert rules for the service platform and core feature certificate management, you can do so in the file located at metrics-grafana-alerts-prd-commercial/alerts/loki_or_mimir_alert/mimir-platform/core-component/certificate_management.json.
{
            "alert": "SLI_CertManagerPodAvailabilityRate",
            "annotations": {
                "message": "`{{ $labels.cluster }}` cluster cert-manager pods availability rate less than 99%"
            },
            "expr": "sum by (cluster)(kube_pod_status_phase{cluster !~ \"e-.*|eng-.*\", namespace=\"cert-manager-v1\", phase=\"Running\", pod!~\"cert-manager-webhook.*|cert-manager-cainjector.*|cert-manager-cronjob.*\"}) / sum by (cluster)(kube_pod_status_phase{cluster !~ \"e-.*|eng-.*\", namespace=\"cert-manager-v1\", pod!~\"cert-manager-webhook.*|cert-manager-cainjector.*|cert-manager-cronjob.*\"}) < 0.99",
            "for": "10m",
            "labels": {
                "contact_point": "core_feature_webhook_alert",
                "severity": "critical",
                "status_fid": "f3167337-9926-4608-8df4-90528cbecdf3",
                "source_url": "https://metrics.o.webex.com/d/d98ad0f8-7ca9-afk349-232fda/cert-management?orgId=1&var-datasource=mimir-platform&var-cluster={{ $labels.cluster }}&from=now-1h&to=now&viewPanel=17"
            }
        }
Here you can see some additional labels: contact_point to correlate with the ISS notification channel in the Grafana, and status_fid to correlate with the service and core features in the ISS.
Then you need to define the contact point, so that once there is any alert, it will send a webhook to ISS.
{
  "name": "core_feature_webhook_alert",
  "webhook_configs": [
      {
        "send_resolved": true,
        "url": "https://iss.ext.webex.com/collector/event/v1/alert-manager"
      }
  ]
}
LMA - Logs 
ISS collector URL: ${ISS_HOST}/collector/event/v1/logs
The LMA logs alert rules are currently defined in the Git repository wbxlma/logging-elastalert2-rules
For example, if you want to define alert rules for the service platform and core feature Monitoring as a Service, you can refer the documentation of elastalert2 and do so in the file located at prd/aws-us-east-1/mas/iss_logs_pipeline_alert.yaml.
iss_logs_pipeline_alert.yaml: |-
  ---
  name: ISS Logs Pipeline Alert
  owner: csg-uas-hz@cisco.com
  is_enabled: true
  type: frequency
  es_host: wxm-app-data.us-east-1.o.webex.com
  es_port: 9200
  index: logstash-wxm-app*
  num_events: 1
  timeframe:
    minutes: 5
  run_every:
    minutes: 5
  filter:
  - query:
      query_string:
        query: >-
            message: "Firing a virtual alert for lma logs" AND tags: "status-aggregation" AND k8s.namespace_name: "mas-alert-prod"
  alert: post2
  http_post2_url: https://iss.ext.webex.com/collector/event/v1/logs
  http_post2_payload: |
    {
    "alertRule": "iss_logs_pipeline_alert",
    "status": "FAIL",
    "labels": {
      "statusFid": "bd670839-24ba-4a88-9620-c6df3f69aafa",
      "dataCenter": "{{ _data['datacenter'] }}",
      "cluster": "{{ _data.wbx3.cluster }}"
    },
    "message": "{{ _data.message }}",
    "time": "{{ _data['@timestamp'] }}",
    "originalLink": "https://logs.o.webex.com/goto/377c44248f64905ae7c79c8a3d458a33?security_tenant=global",
    "resolveTimeout": 900
    }
Firstly, define the condition that would trigger the alert and then choose post2 as the alert type.
http_post2_url: ISS collector URL
alertRule: alert rule name
statusFid: correlate with the service and core features in the ISS.
dataCenter and cluster: show core feature status by locations
status: leave it as "FAIL"
message and time: copy it as recommended
originalLink: link to redirect back to logs.o.webex.com
resolveTimeout: Usually, ISS requires an alert to start firing and be resolved to end its lifecycle. However, for elastalert2, it is not easy to write or maintain a resolve rule. In this case, ISS will automatically resolve this alert if it doesn't receive it for 900 seconds.
MCT 
ISS collector URL: ${ISS_HOST}/collector/event/v1/mct
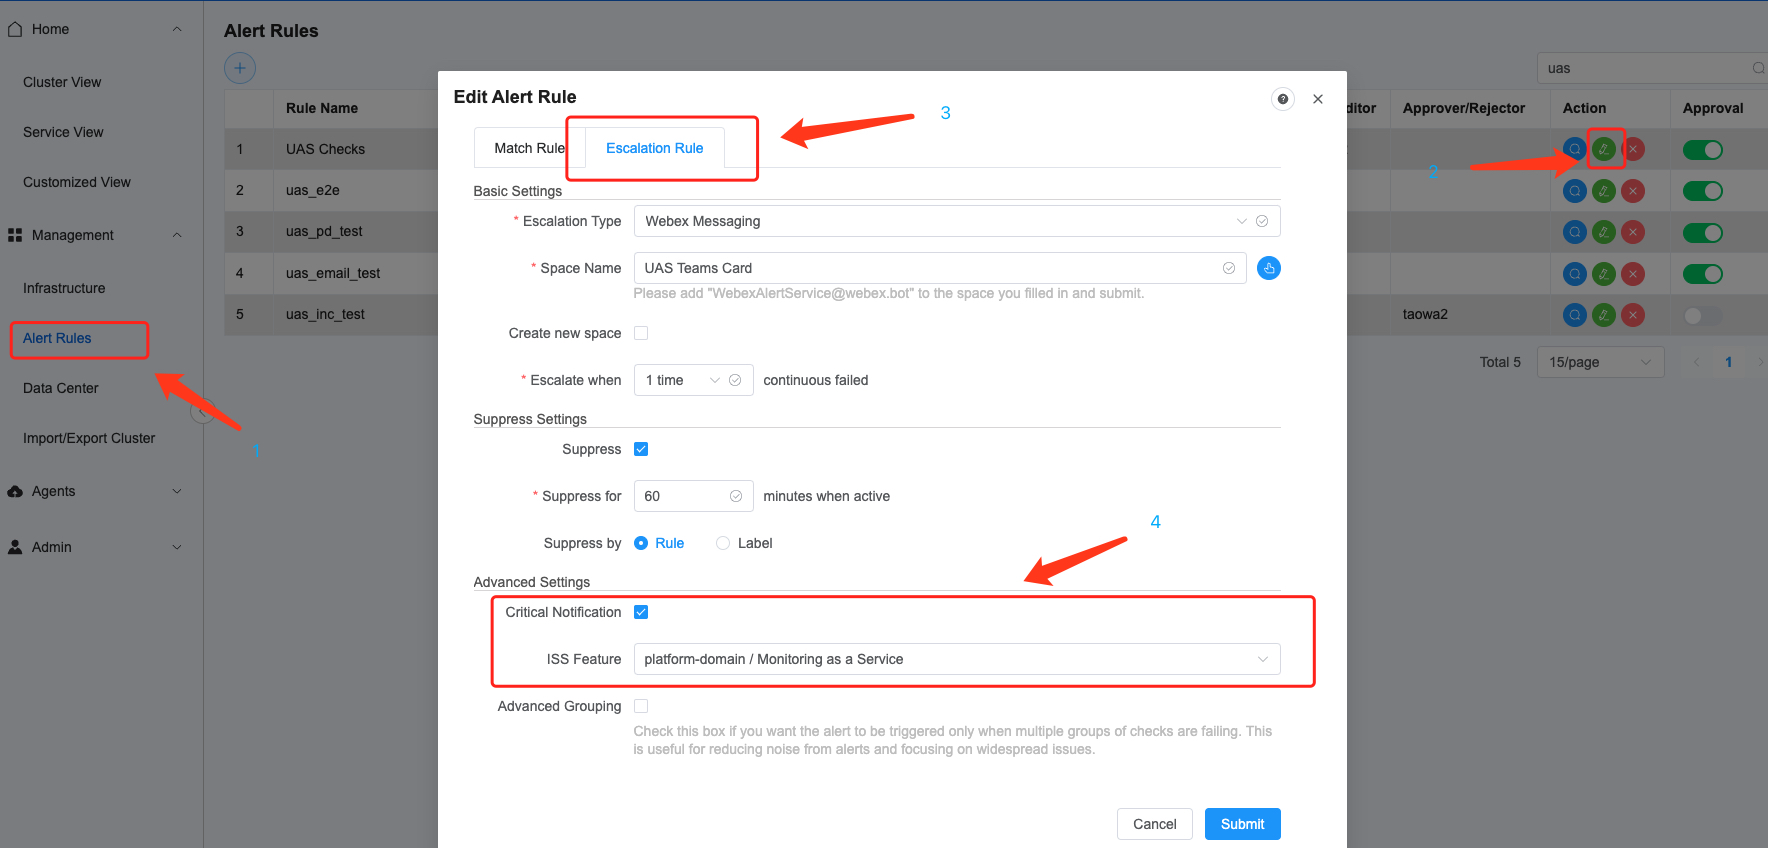
One MCT alert rule is divided into two parts: the Match Rule and the Escalation Rule. In the Escalation Rule, check Critical Notification and choose ISS Feature by selecting the correct service and core feature.
Then, once there is any alert for this MCT alert rule, the alert will be forwarded to ISS.
Apdex 
ISS collector URL: ${ISS_HOST}/collector/event/v1/apdex
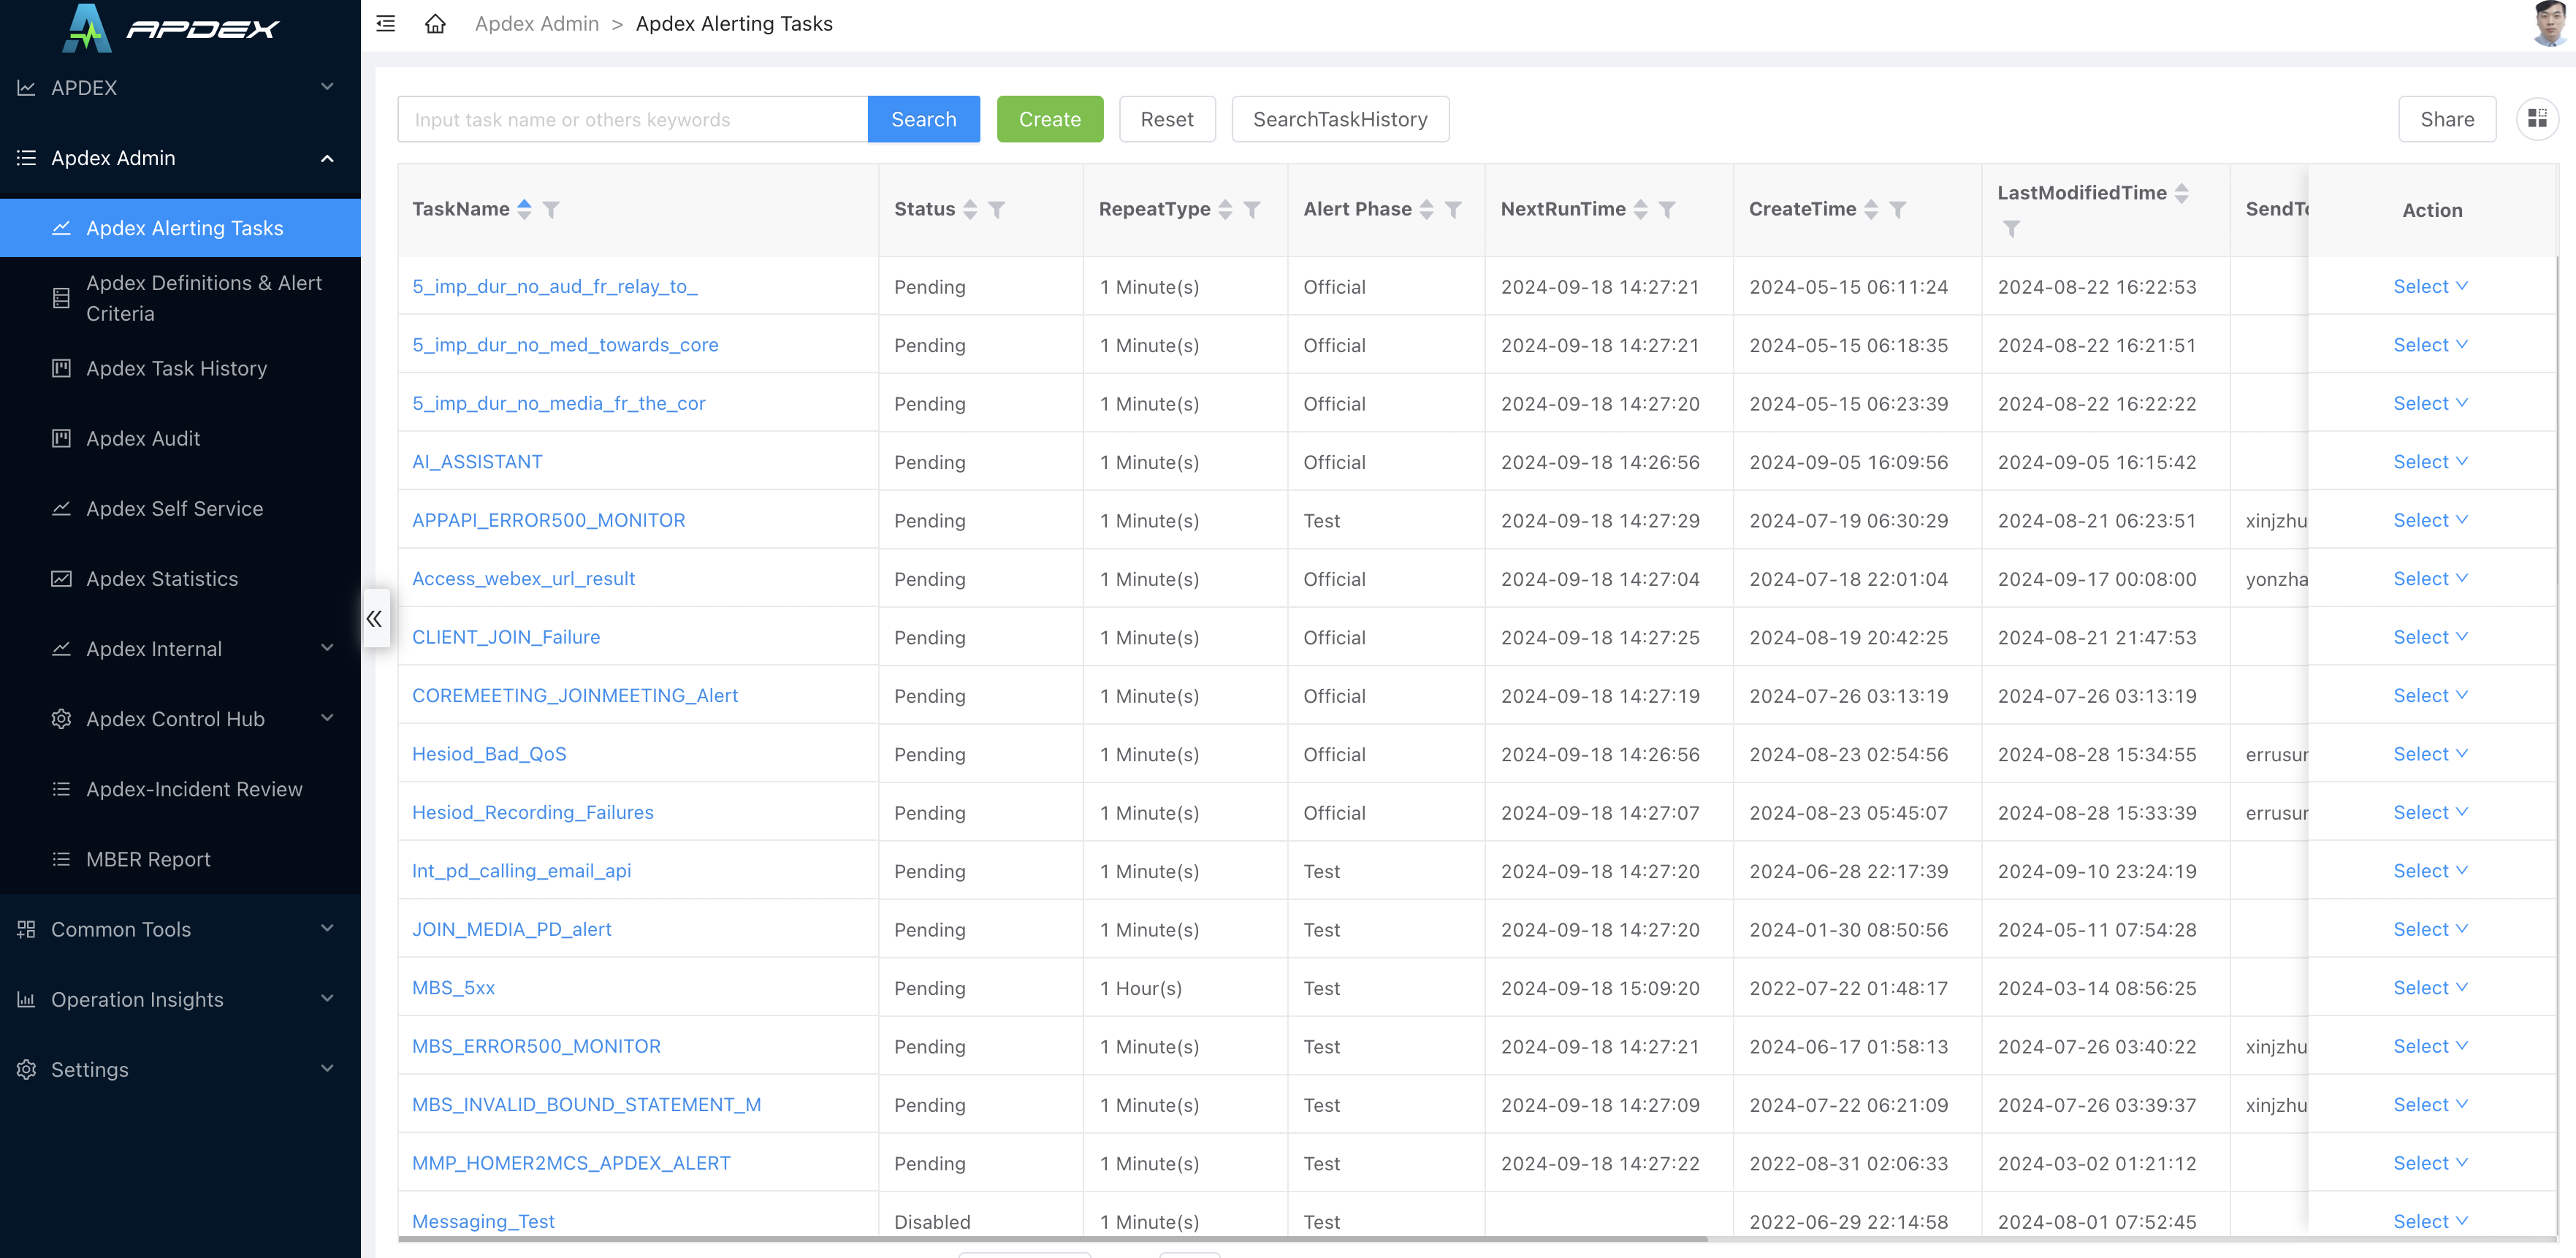
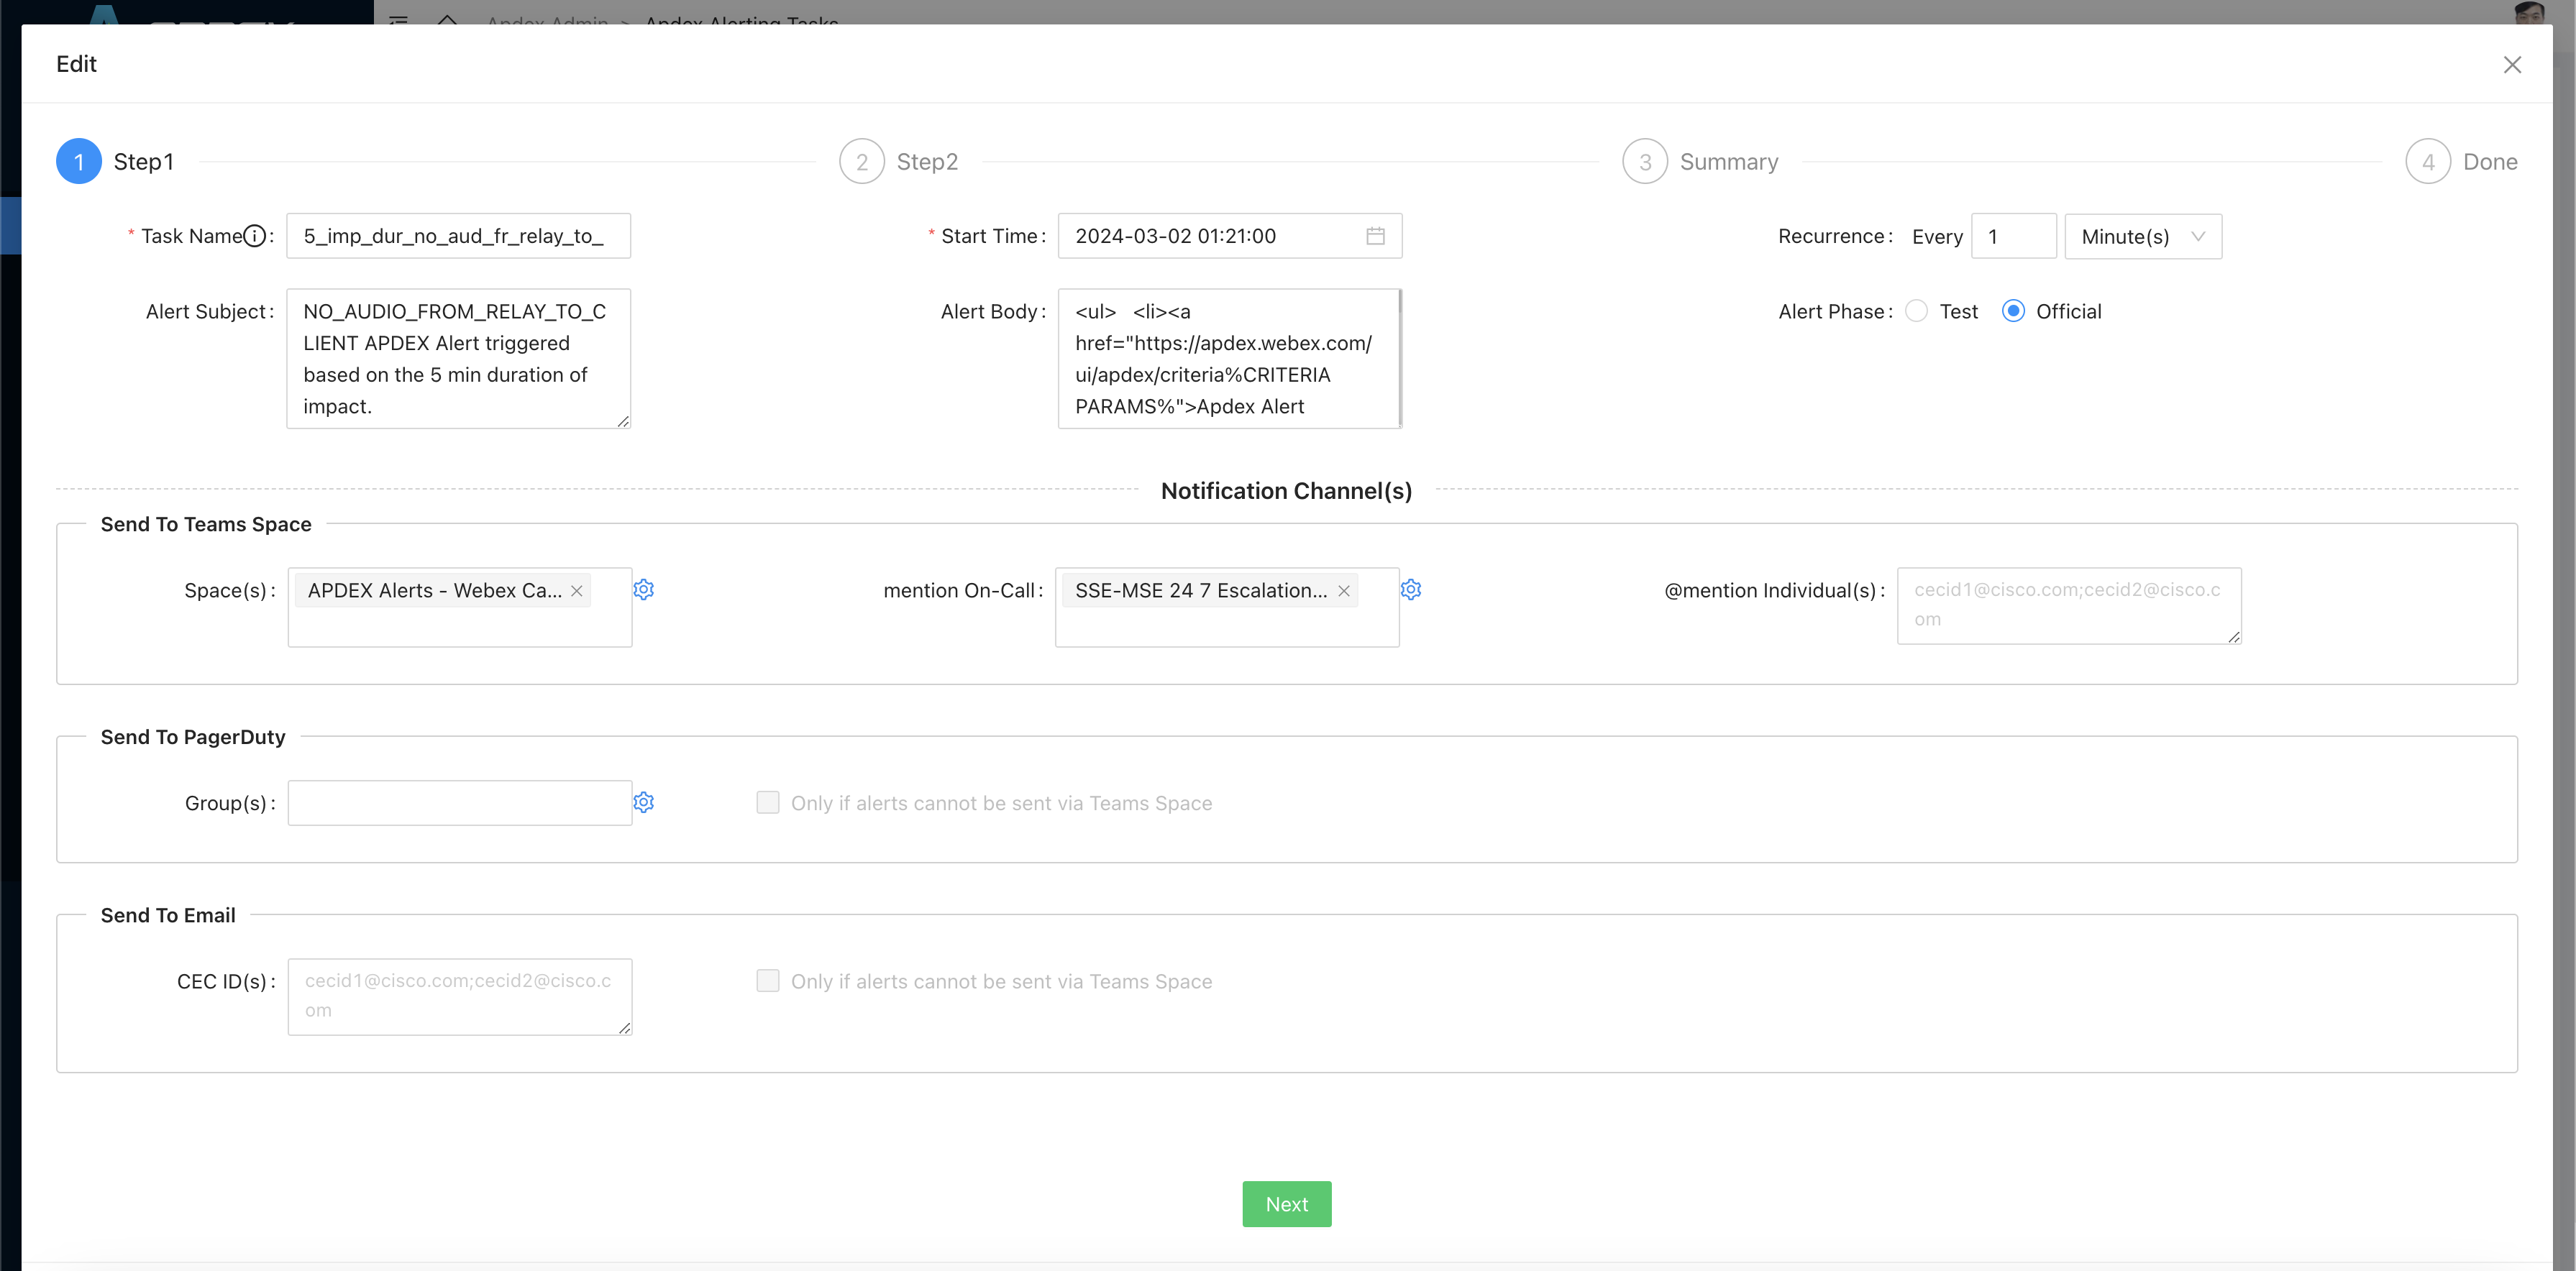
For Apdex alerts ingestion, users only need to create an alert task and configure the alert phase as official. The corresponding alerts will then be automatically sent to ISS with the pairs "coreService" and "coreFeature."
Thousandeyes 
ISS collector URL: ${ISS_HOST}/collector/event/v1/thousand-eyes
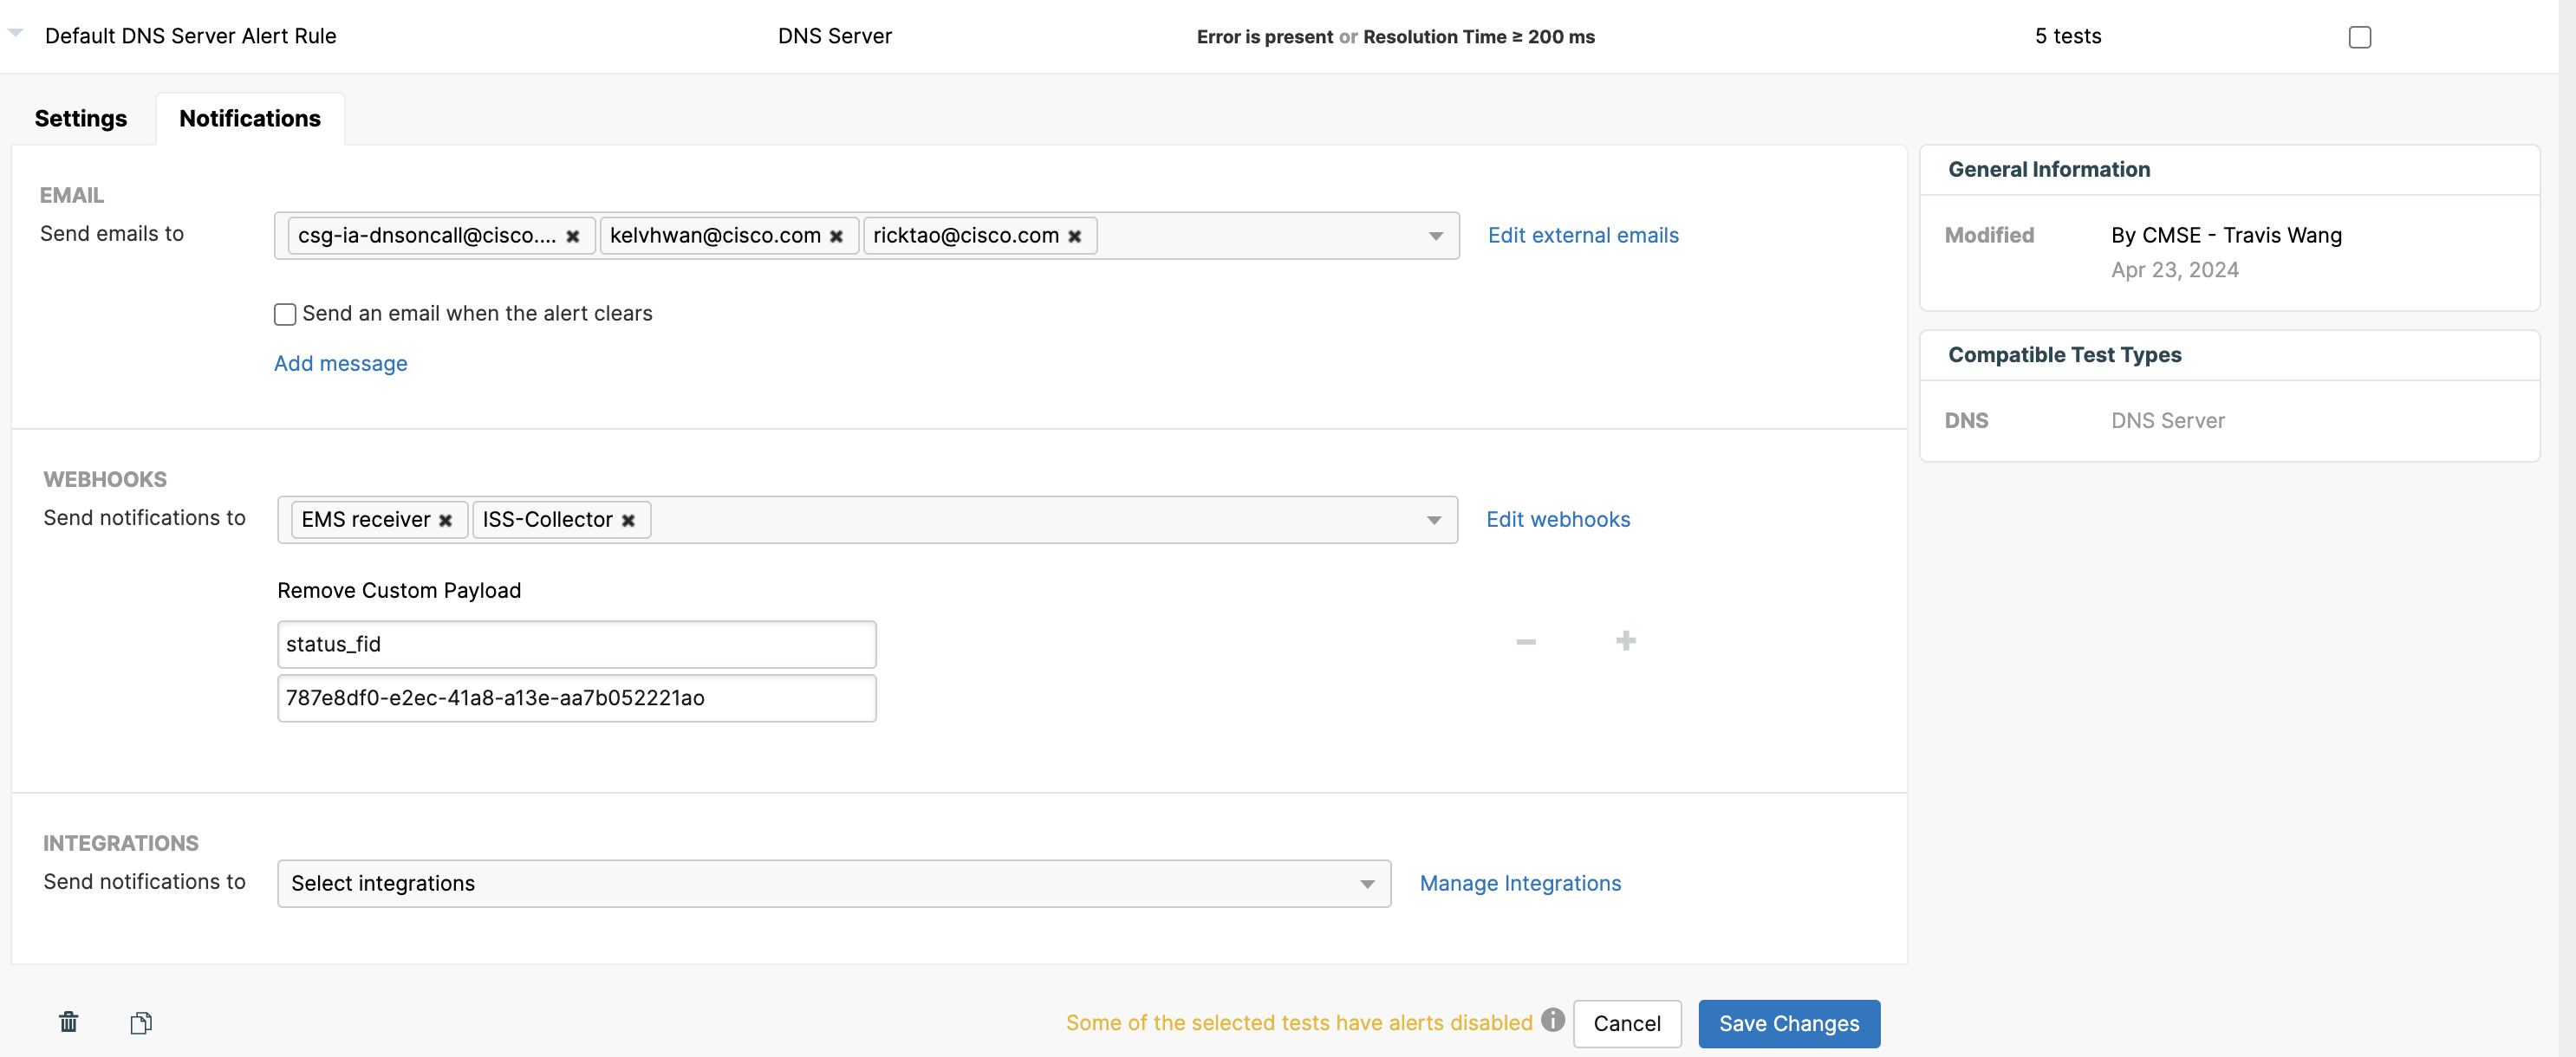
You need to create or edit an alert rule for your tests in ThousandEyes. Using a DNS server alert rule as an example, in the Notification section, add a new webhook named ISS-Collector. This webhook will forward alerts to the ISS ThousandEyes collector API at ${ISS_HOST}/collector/event/v1/thousand-eyes. Include a custom payload such as status_fid = 787e8df0-e2ec-41a8-a13e-aa7b052221ao or coreService = Platform and coreFeature = DNS. In this manner, alerts with this payload will be correlated with the service Platform and the core feature DNS in the ISS.
Post 
There are two modes available to post your alerts into ISS: one is the standard mode, and the other is the customized mode.
Standard: 
ISS collector URL: ${ISS_HOST}/collector/event/v1/standard
Body Parameters 
eventId string required
fingerprint id, so that ISS can track the lifecycle of one alert, including when it is firing and when it is resolved. For example, eventId of mct tools is id of checks. eventId of thousandeyes is id of tests. eventId of grafana is fingerprint of an alert
source string required
name of monitoring tools, such as thousandeyes, mct, grafana, logs, jenkins and so on
type string optional
If empty, it will have the same value as the source. However, if you are running the tap test on MCT, then the source will be MCT and the type will be tap
originalId string optional
id for alert this time
originalLink string required
original link of alert, users can redirect back to the original monitoring tools using it
target string required
object of alert, such as a service, a host or a cluster and so on
label Map
map where both the keys and values are strings. It is used to store a set of key-value pairs, such as:
statusFid string required
dataCenter string required
shard string required
message string required
payload of alert
checkType string required
check type of alert, such as port check, or a promotheus rule name
status string optional
status of alert: Fail, Pass
issued long required
firing time in milliseconds of alert
end long optional
resolved time in milliseconds of alert
Customized: 
ISS collector URL: ${ISS_HOST}/collector/event/v1/customized
You do not need to send alerts to ISS in the standard format; you can use a customized one instead. However, a YAML file should be created to map between the customized format and the standard format. Currently, the ISS team maintains this file for different source, such as mct, grafana, apdex and so on, but in the future, you can request a PR to maintain your own one in internal service status,
{
    "eventId": "concat(-,alert-manager,$.labels.alertname,$.labels.cluster)",
    "status": "conditionMatch(equals,$.status,firing)",
    "target": "conditionMatch(equals,$.labels.name,,any)?$.labels.cluster:$.labels.name",
    "checkType": "$.labels.alertname",
    "source": "alert-manager",
    "type": "grafana",
    "label": {
      "domain": "$.labels.domain",
      "statusFid": "$.labels.status_fid",
      "@ISS_INTERMEDIATE_LOCATION_KEY": "$.labels.cluster",
      "@APPEND": "labels"
    },
    "message": "$.annotations.message",
    "issued": "toTimestampDtf($.startsAt)",
    "end": "conditionMatch(equals,$.status,firing)?0:toTimestampDtf($.endsAt)",
    "originalLink": "$.labels.source_url"
  }
Result 
Critical alerts are displayed on ISS based on time. ISS categorizes alerts into two types: RUM (Real User Metrics), which refers to Apdex, and Synthetic, which can include sources such as ThousandEyes, MCT, TAP, LMA - Grafana, and others.
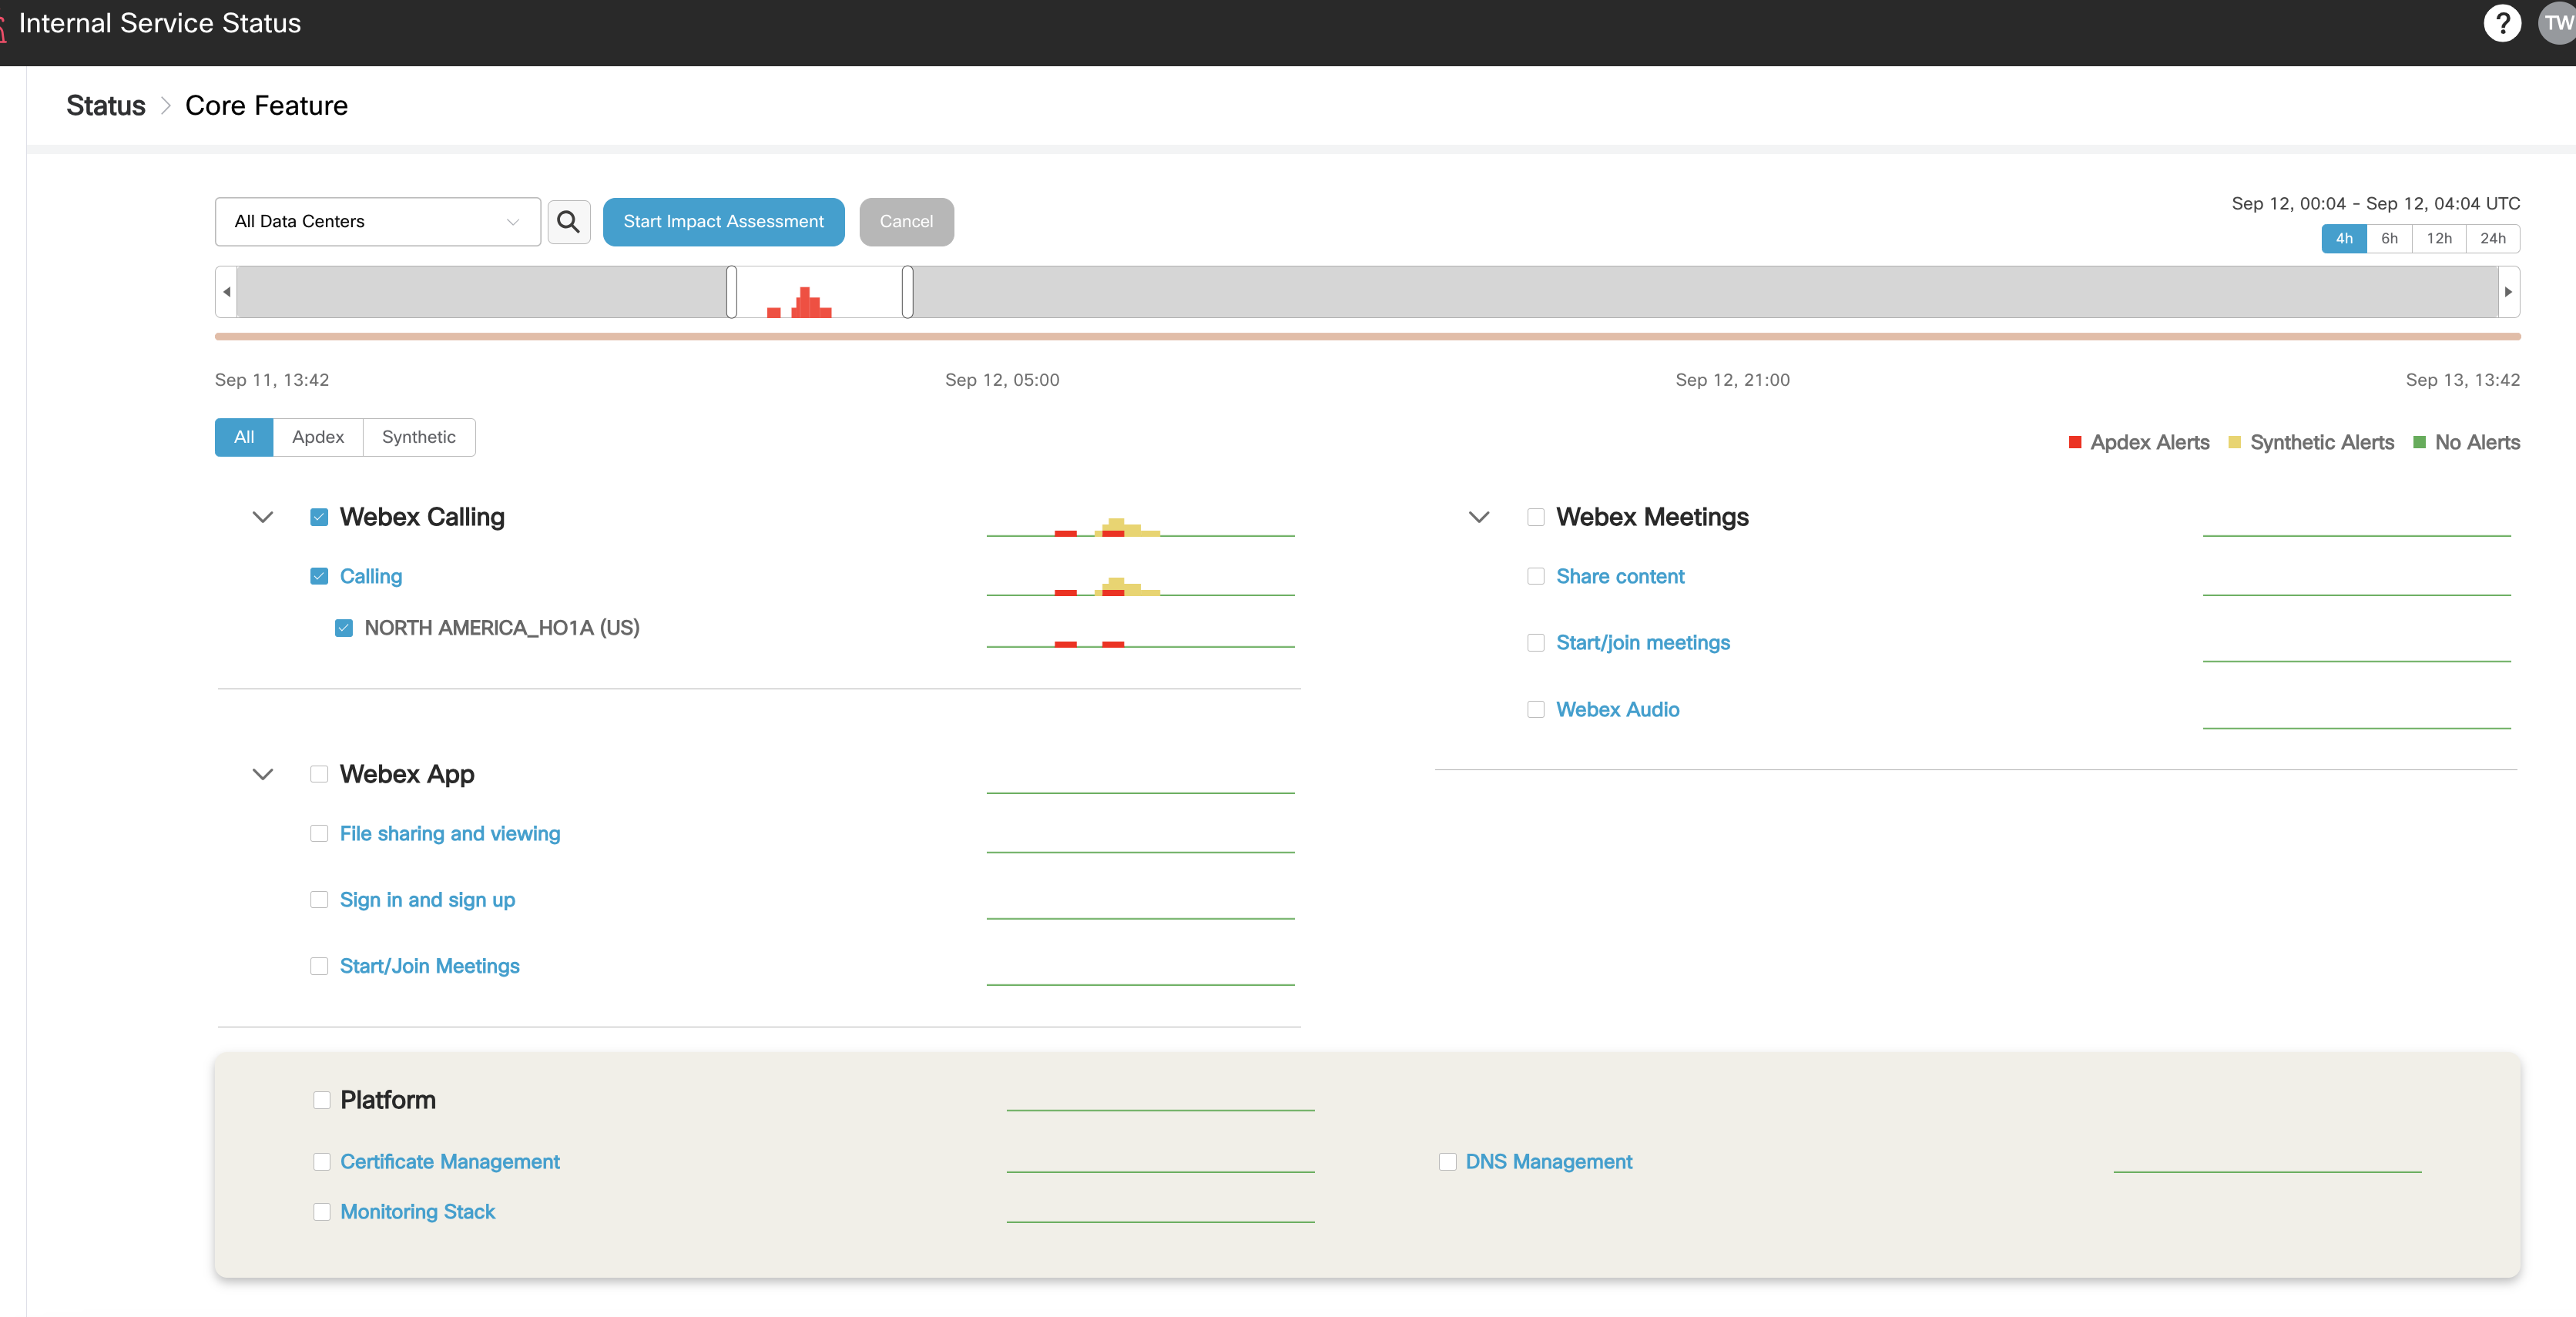
As the snapshot shows, there are critical alerts for the service: Webex Calling, core feature: Calling. The red bar indicates Apdex alerts, while the yellow bar represents synthetic alerts.
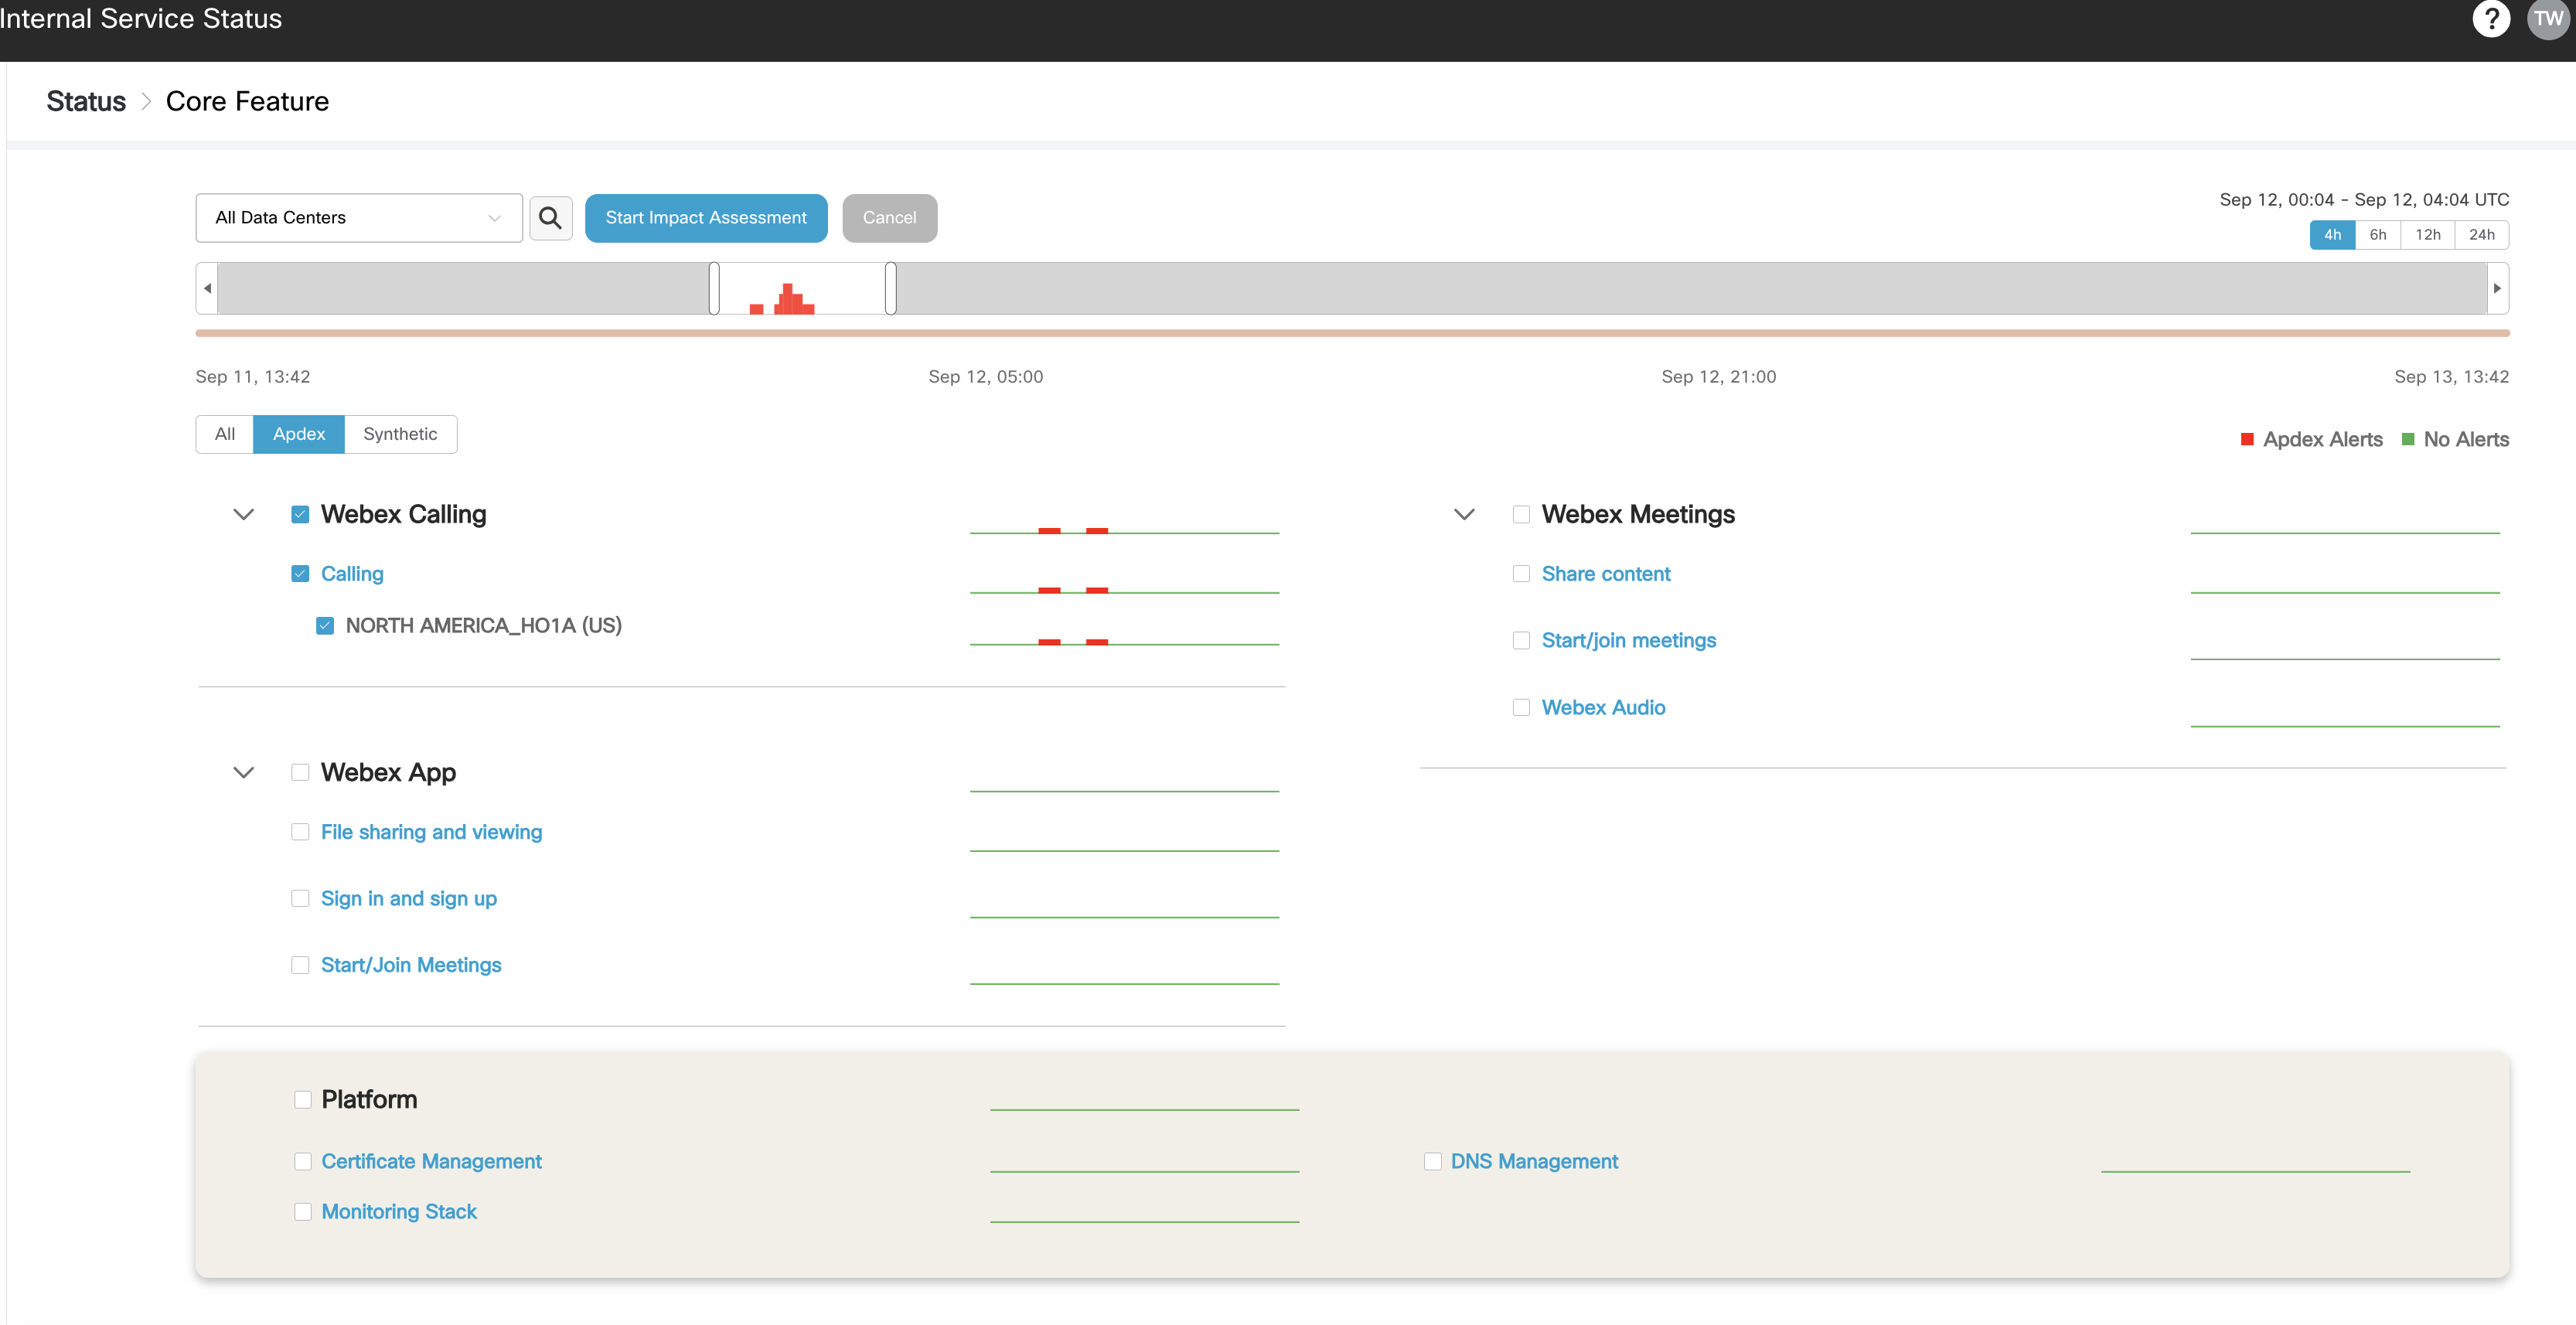
Apdex alerts extend from region to country, datacenter, and clusters. If synthetic alerts are present at the same level, you may find a correlation between them.
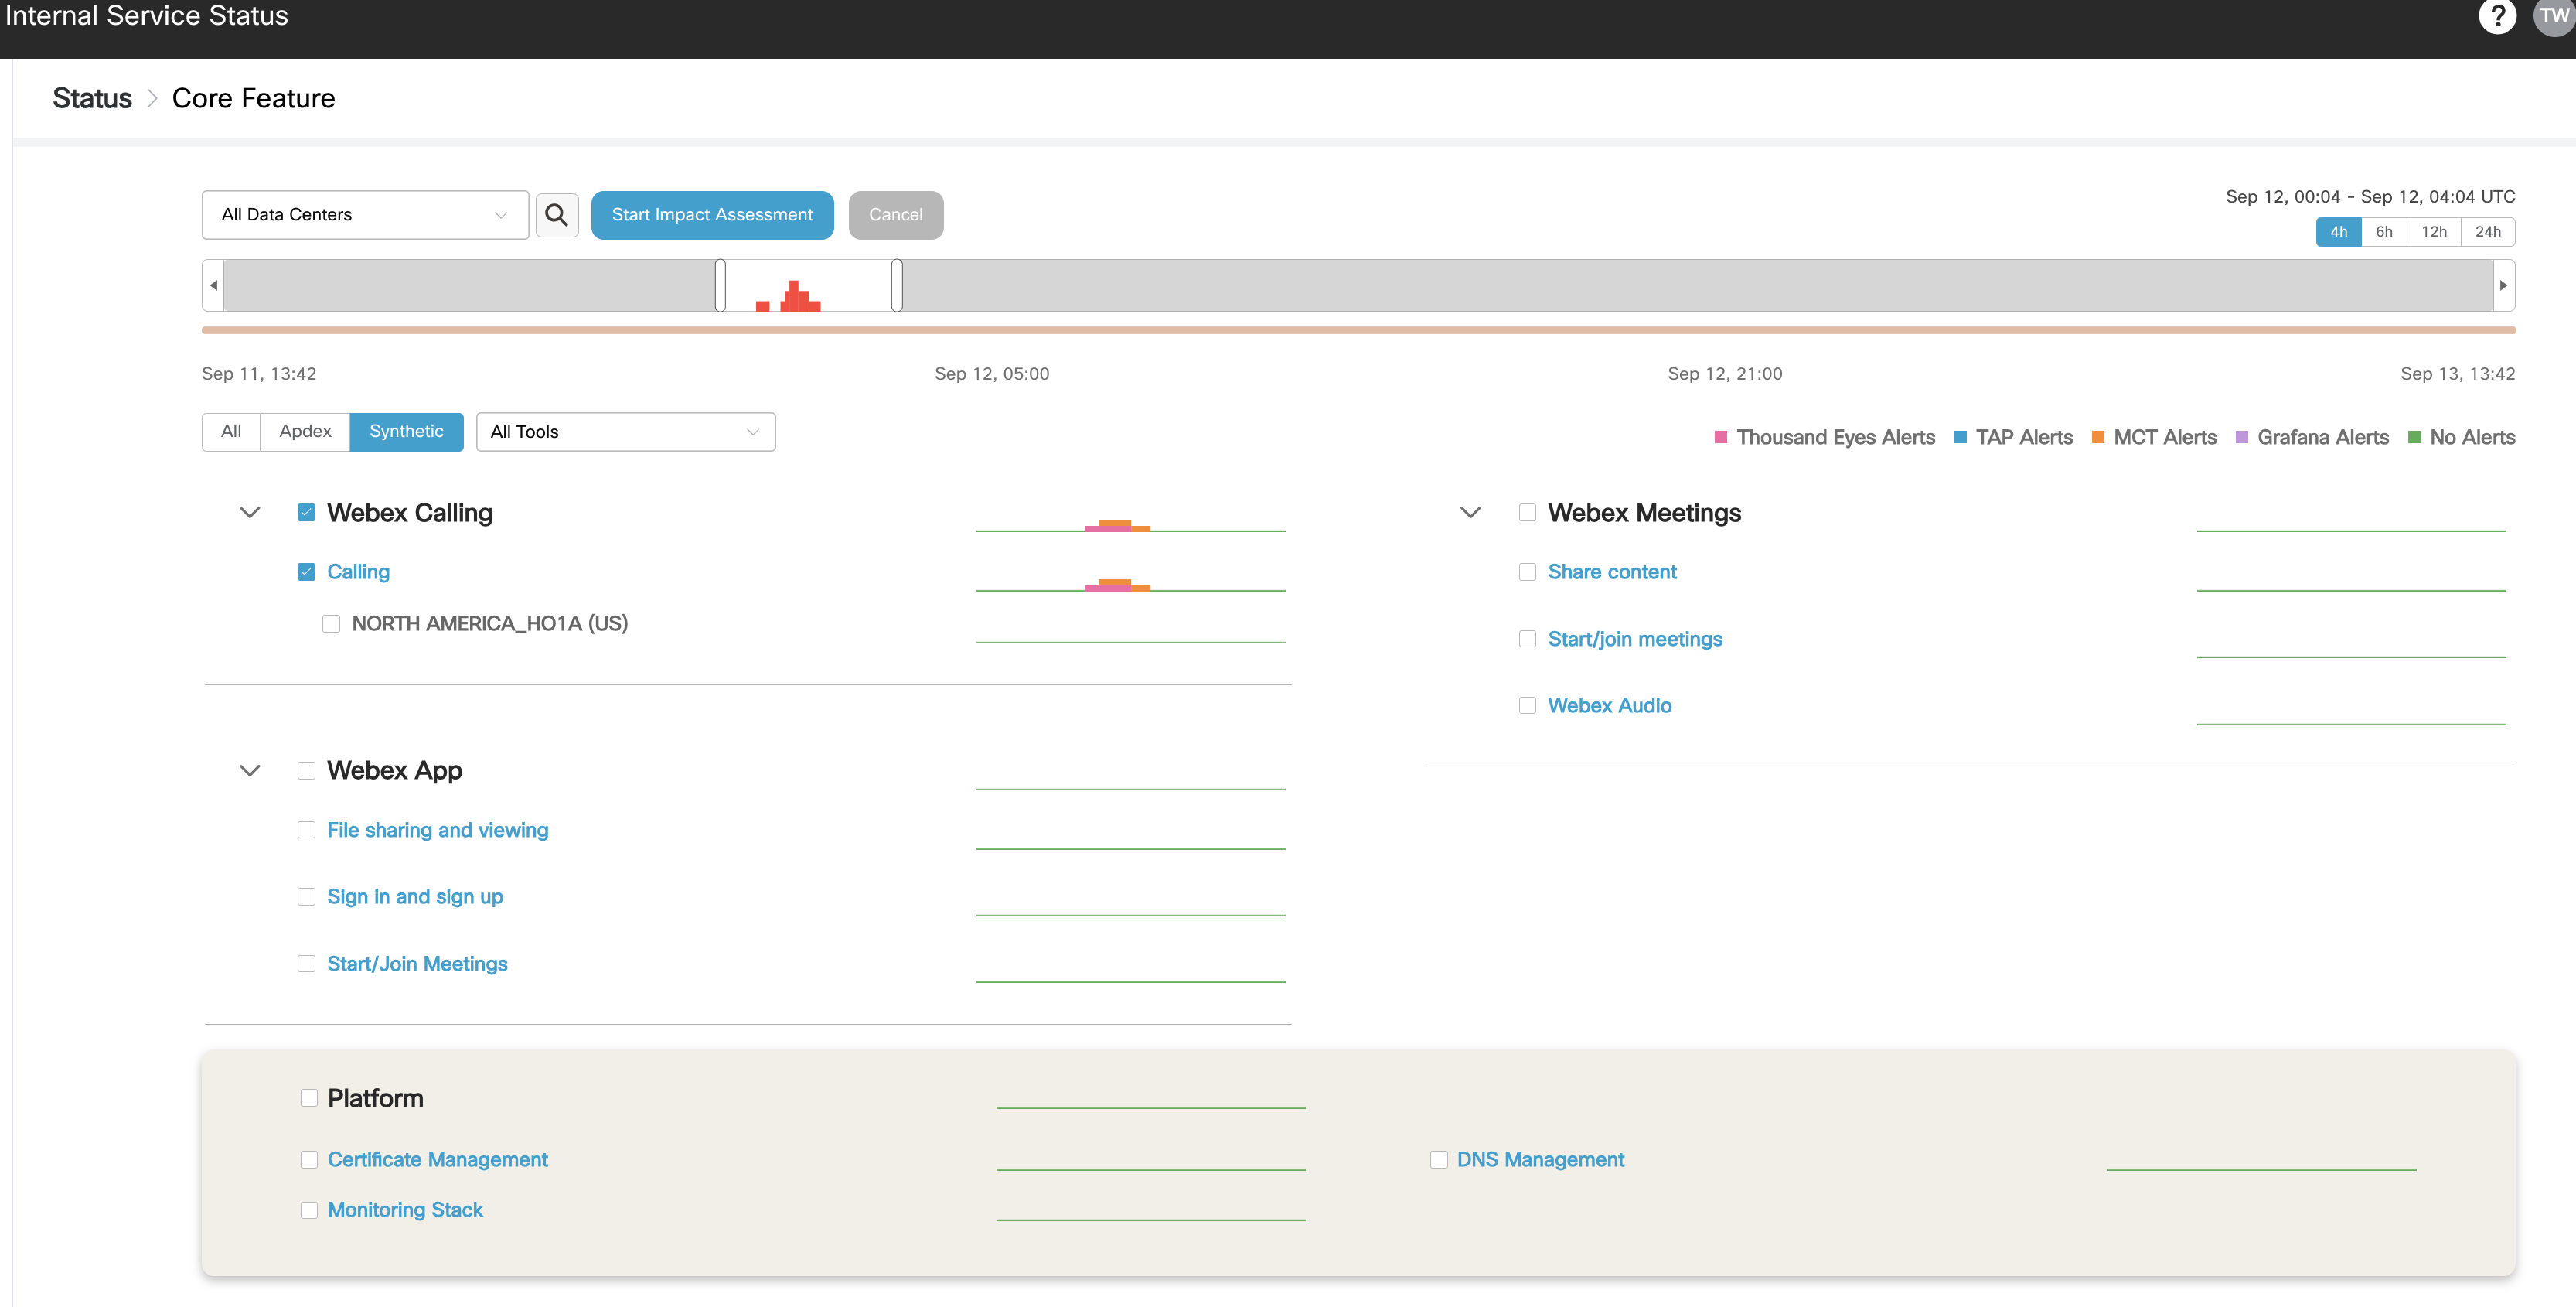
Different types of synthetic alerts are displayed in different colors, making it obvious to identify multiple critical alerts for a single core feature at the same location and time.
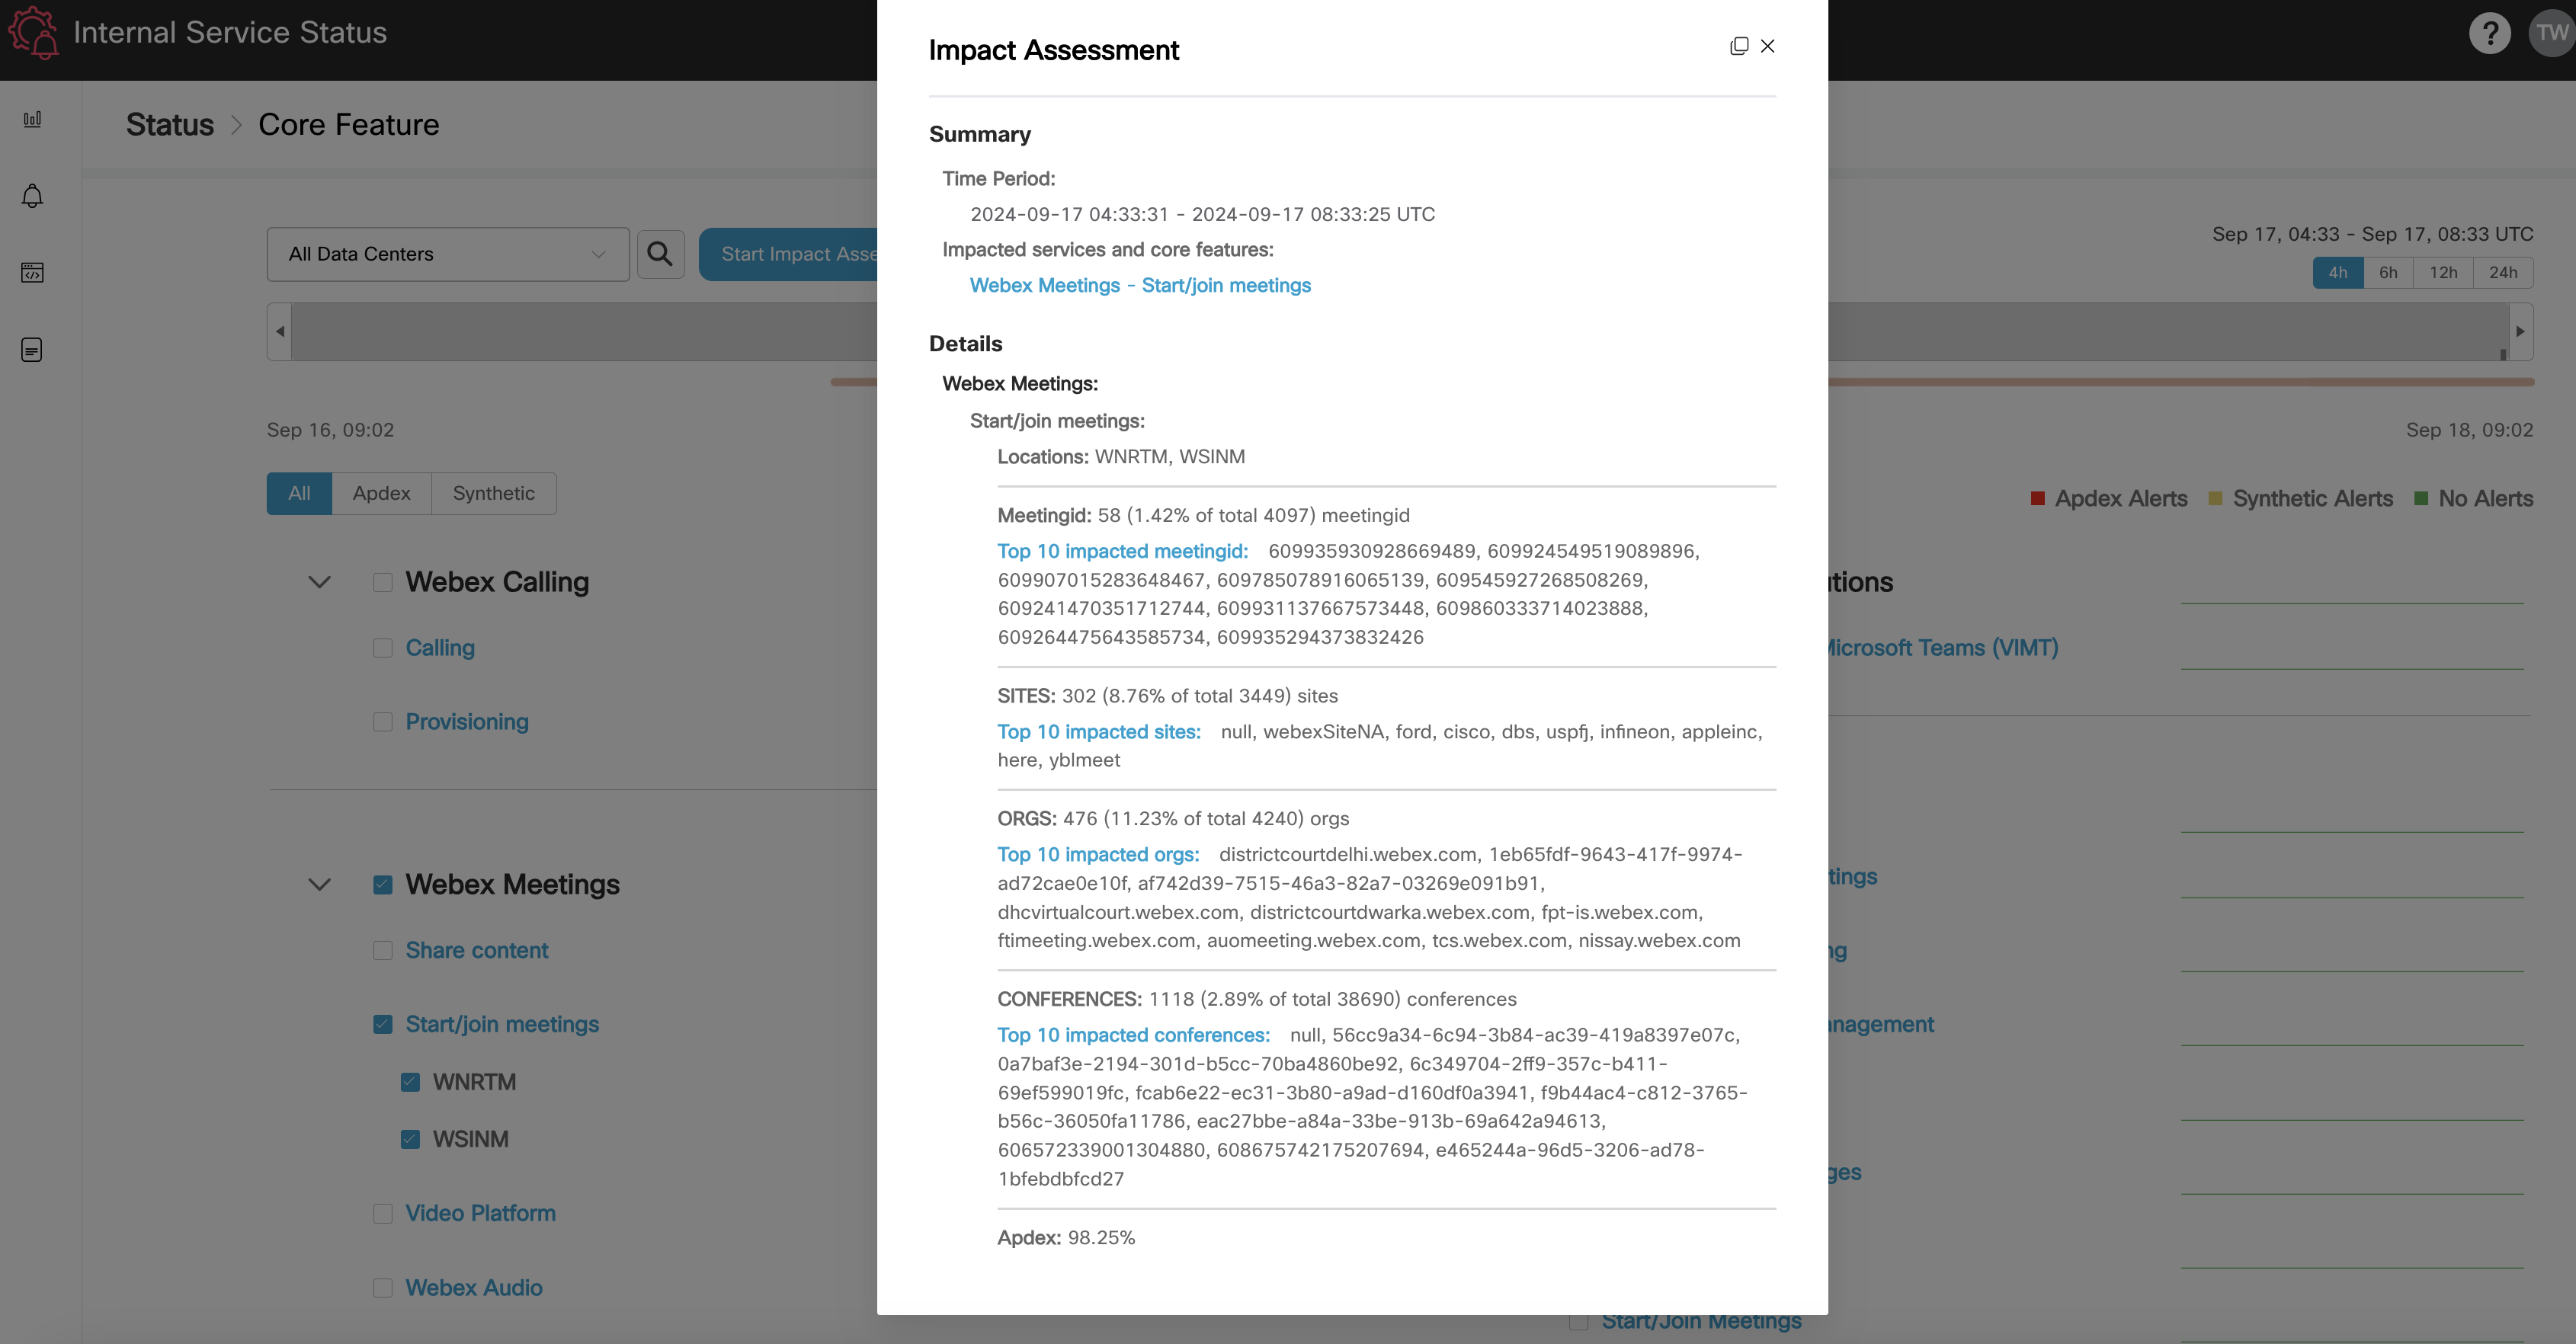
With the ISS portal, you can even perform impact assessments, allowing you to understand the customer impact at the time of the critical alerts.