Operation Dashboard
Environment 
- The target Grafana endpoint is: metrics.o.webex.com
- Search
Dashboardby name ofMCT Dashboard - The entry for all MCT Dashboards is HERE
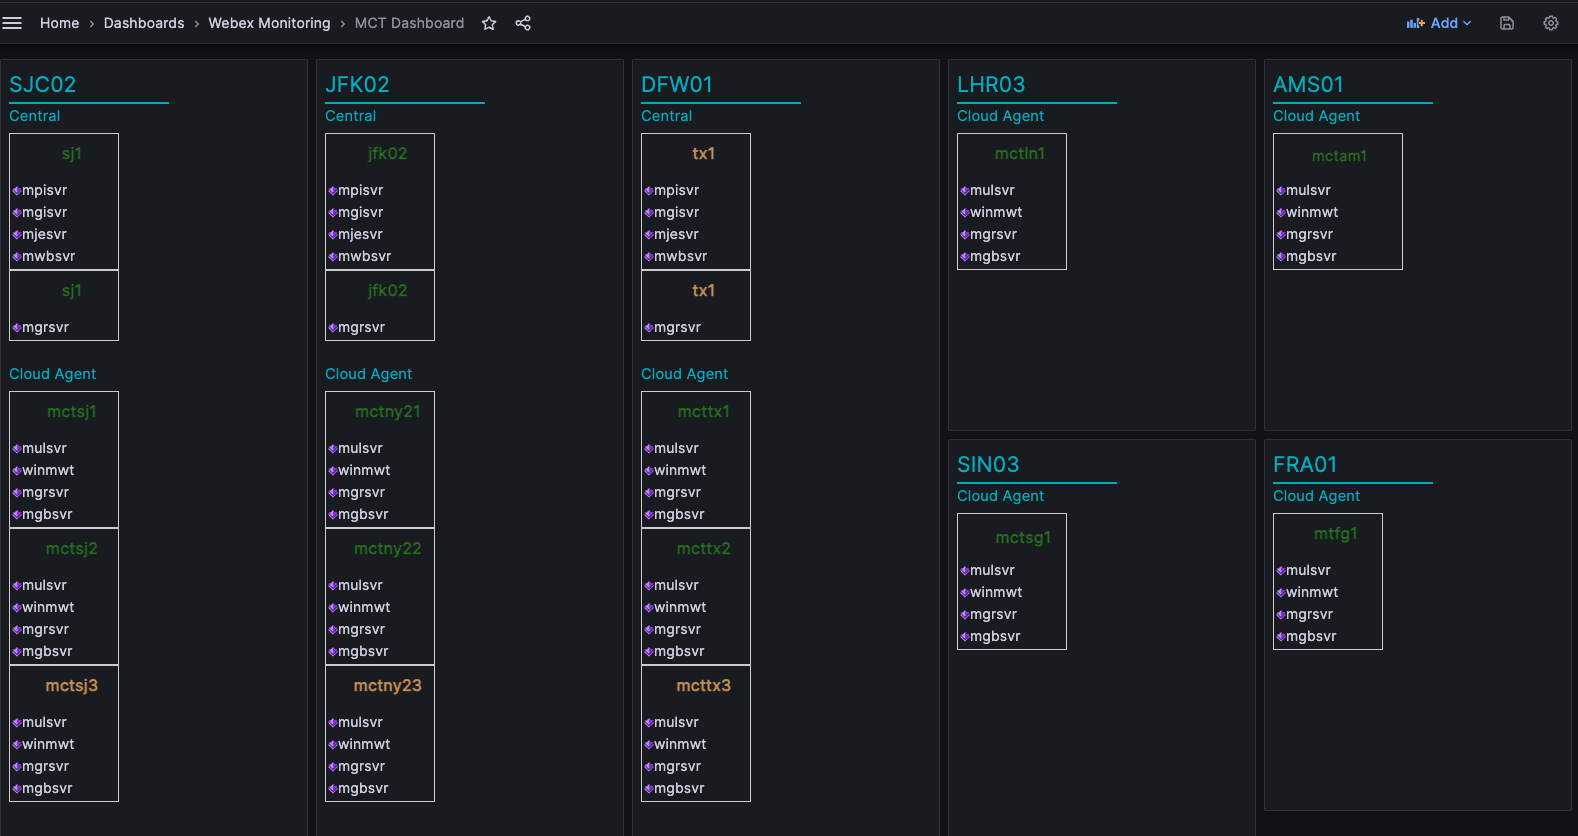
Central Cluster 
Considering the flexibility of query, and also leverage variable in Grafana, will define below variables:
Variable List 
wbxdc: sjc02, dfw01, jfk02wbxsvrtype: mgisvr, mpisvr, mwbsvr, mjesvr, mgrsvr
Panel Title 
[metrics-name] {{wbxdc}} {{wbxsvrtype}}
Option 
{{wbxsvrtype}}-{{host}}
General Metrics Type 
- cpu utilization percentage:
100-cpu_usage_idle{wbxdc="$wbxdc", wbxsvrtype="$wbxsvrtype"} - memory utilization percentage:
mem_used_percent{wbxdc="$wbxdc", wbxsvrtype="$wbxsvrtype"} - disk utilization percentage in '/':
disk_used_percent{path="/", wbxdc="$wbxdc", wbxsvrtype="$wbxsvrtype"} - disk utilization percentage in '/var/log':
disk_used_percent{path="/var/log", wbxdc="$wbxdc", wbxsvrtype="$wbxsvrtype"} - net packets received
rate(net_packets_recv{wbxdc="$wbxdc", wbxsvrtype="$wbxsvrtype"}[10m]) - net packets sent
rate(net_packets_sent{wbxdc="$wbxdc", wbxsvrtype="$wbxsvrtype"}[10m]) - processes total:
processes_total{wbxdc="$wbxdc", wbxsvrtype="$wbxsvrtype"} - swap used percentage:
swap_used_percent{wbxdc="$wbxdc", wbxsvrtype="$wbxsvrtype"}
Redis Server Metrics Type 
This is for the mgrsvr servers which runs Redis on the server. e.g. jfk mgrsvr redis dashboard
- number of clients connected to Redis:
redis_clients{wbxdc="$wbxdc", wbxsvrtype="$wbxsvrtype"} - amount of memory (in bytes) used by Redis:
rate(redis_used_memory{wbxdc="$wbxdc", wbxsvrtype="$wbxsvrtype"}[1h]) - total number of commands processed per second:
redis_instantaneous_ops_per_sec{wbxdc="$wbxdc", wbxsvrtype="$wbxsvrtype"} - total number of keys in your database:
redis_keyspace_keys{wbxdc="$wbxdc", wbxsvrtype="$wbxsvrtype"} - total number of successful hits of keys:
rate(redis_keyspace_hits{wbxdc="$wbxdc", wbxsvrtype="$wbxsvrtype"}[1h]) - number of failed lookups of keys:
rate(redis_keyspace_misses{wbxdc="$wbxdc", wbxsvrtype="$wbxsvrtype"}[1h])
Agent Cluster (Linux) 
Variable List 
wbxdc: sjc02, dfw01, jfk02, ams01, fra01, lhr03, sin01wbxsvrtype: mgbsvr, mgrsvr, mulsvrwbxpool: mctsj1, mctsj2, mctsj3
Panel Title 
- same as General Panel Title ☝️
Option 
- same as Option ☝️
General Metrics Type 
- cpu utilization percentage:
100-cpu_usage_idle{wbxdc="$wbxdc", wbxsvrtype="$wbxsvrtype", wbxpool="$wbxpool"} - memory utilization percentage:
mem_used_percent{wbxdc="$wbxdc", wbxsvrtype="$wbxsvrtype", wbxpool="$wbxpool"} - disk utilization percentage in '/':
disk_used_percent{path="/", wbxdc="$wbxdc", wbxsvrtype="$wbxsvrtype", wbxpool="$wbxpool"} - disk utilization percentage in '/var/log':
disk_used_percent{path="/var/log", wbxdc="$wbxdc", wbxsvrtype="$wbxsvrtype", wbxpool="$wbxpool"} - net packets received
rate(net_packets_recv{wbxdc="$wbxdc", wbxsvrtype="$wbxsvrtype", wbxpool="$wbxpool"}[10m]) - net packets sent
rate(net_packets_sent{wbxdc="$wbxdc", wbxsvrtype="$wbxsvrtype", wbxpool="$wbxpool"}[10m]) - processes total:
processes_total{wbxdc="$wbxdc", wbxsvrtype="$wbxsvrtype", wbxpool="$wbxpool"} - swap used percentage:
swap_used_percent{wbxdc="$wbxdc", wbxsvrtype="$wbxsvrtype", wbxpool="$wbxpool"} - total open file handlers:
sum(procstat_num_fds{wbxdc="$wbxdc", wbxsvrtype="$wbxsvrtype", wbxpool="$wbxpool"}) by (host)
Redis Server Metrics Type 
- same as Redis Server Metrics ☝️
Agent Cluster (Windows) 
Variable List 
wbxdc: sjc02, dfw01, jfk02, ams01, fra01, lhr03, sin01wbxsvrtype: winmwt
How to Set up 
Please refer to Metrics Enablement on How to install mavclient to enable metrics collection