Automating RCA with the EAP RCA agent
Why An EAP Agent For RCA? 
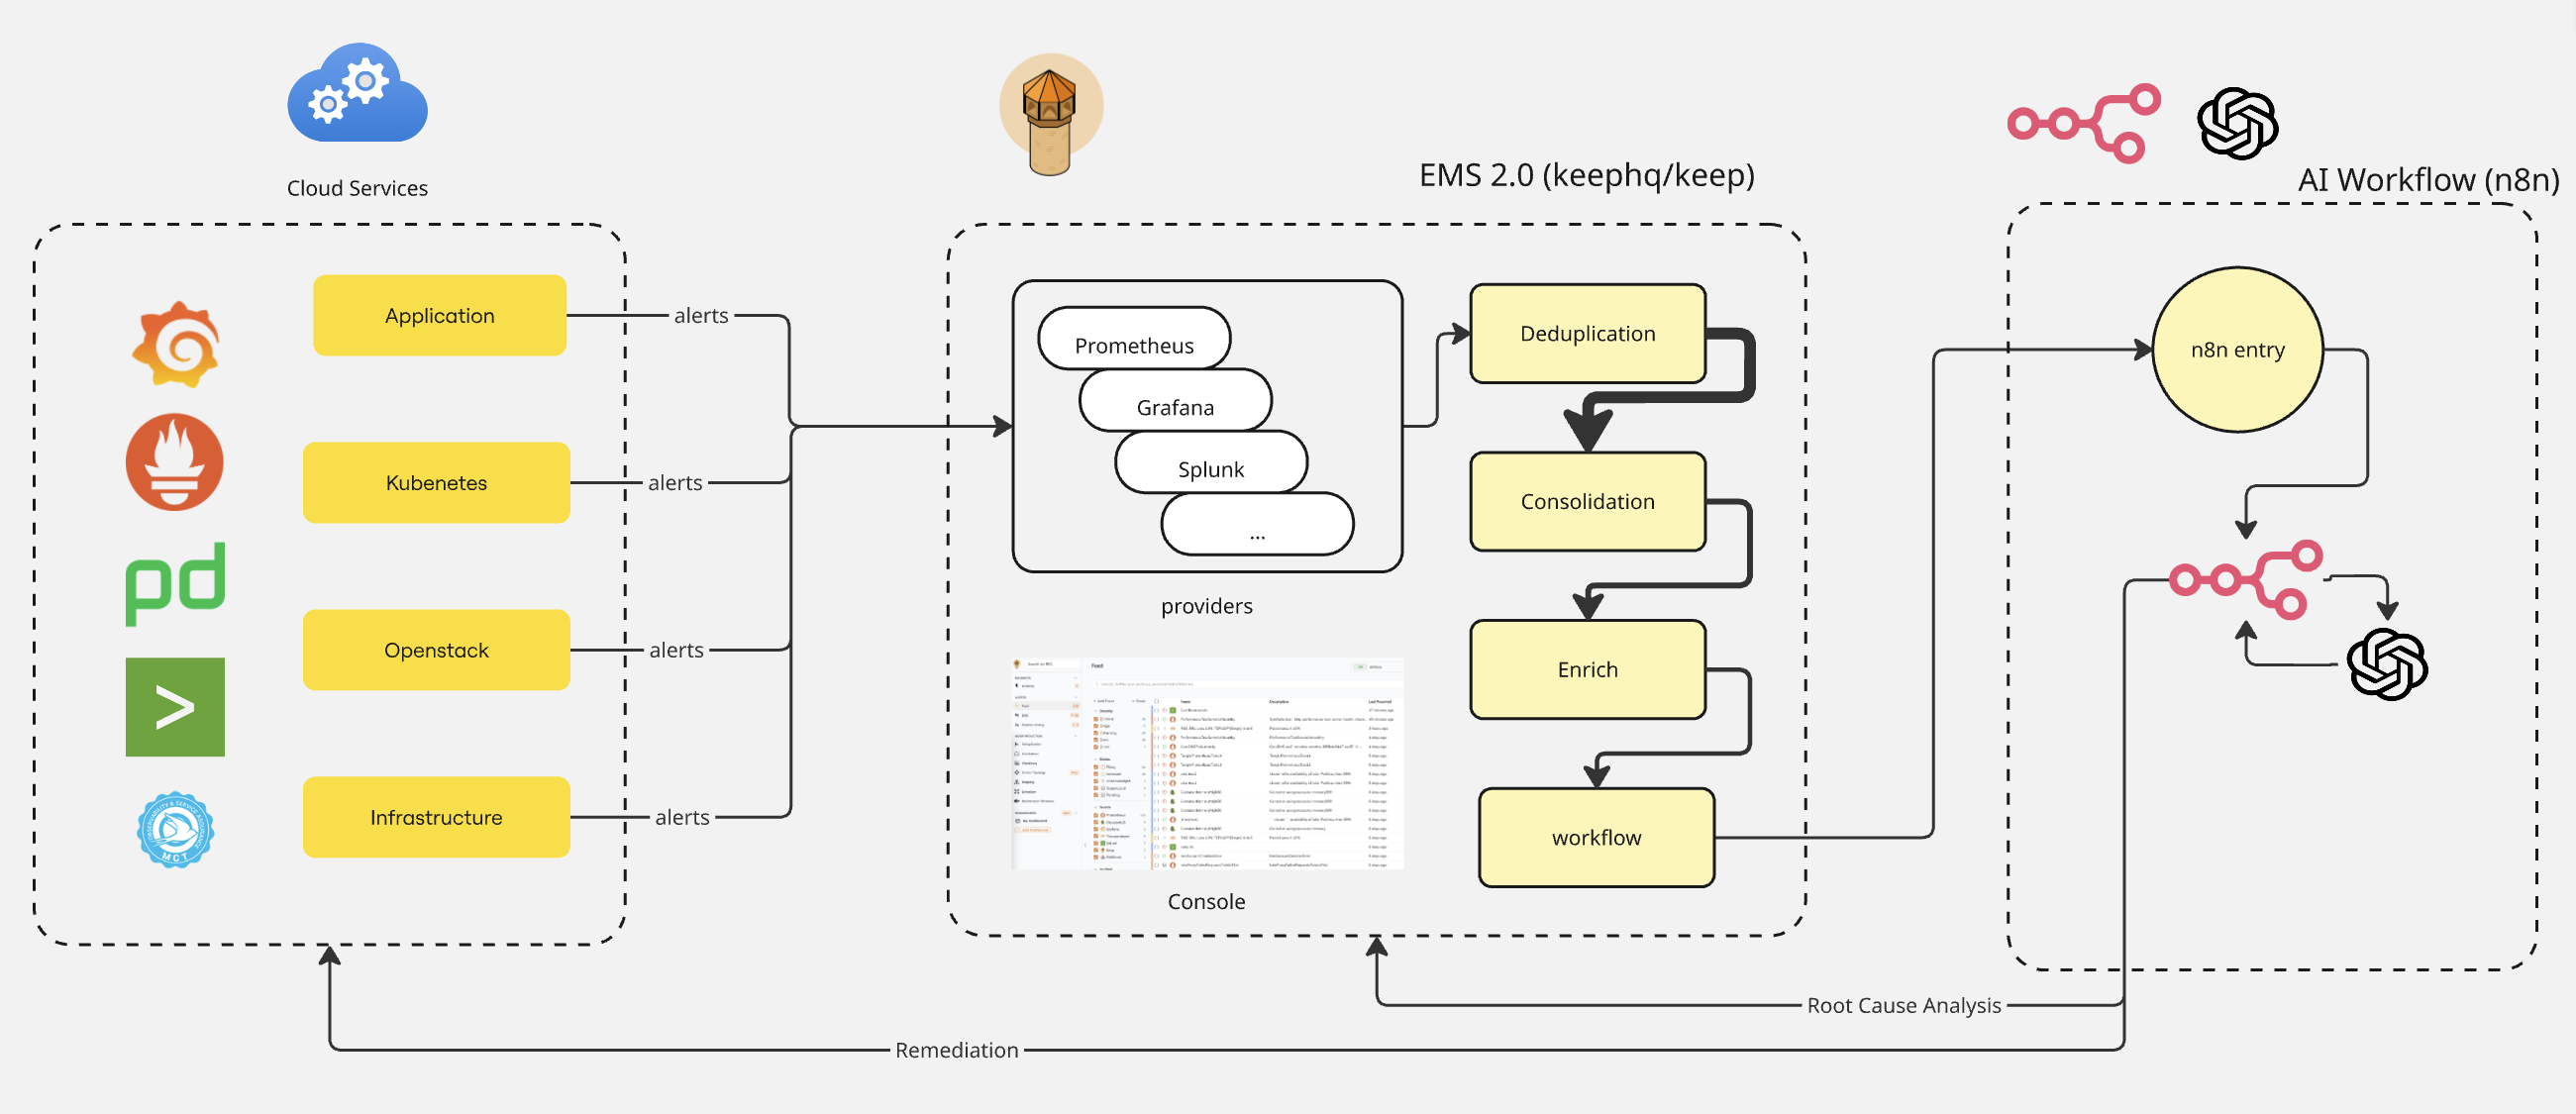
Root Cause Analysis (RCA) for our platform requires aggregating logs, metrics, traces, configuration snapshots, and alerts across many systems (Prometheus, Loki, Elasticsearch, Grafana, Kubed, etc.). The RCA capability previously delivered via n8n workflows is now provided by a reviewed agent on the Enterprise Agent Platform (EAP), invoked through the EAP Simple Agent API. The functional behavior — alert in, layered diagnostic checks, LLM-assisted root-cause report — is the same. The hosting model is the governed agent runtime.
- Automated data collection across systems — the RCA agent's skills call approved MCP servers (Prometheus, Grafana, Kubed, etc.) to gather evidence in parallel, the same way the old workflow did.
- Standardized RCA process with LLM integration — the agent runs a consistent, auditable diagnostic sequence. The Cisco LLM Proxy analyzes the aggregated evidence and produces root-cause hypotheses and remediation suggestions.
- Event-driven RCA initiation — callers (EMS2, Keep, PagerDuty, or other alert sources) invoke the RCA agent through the EAP Simple Agent API endpoint, replacing the old n8n webhook entry point.
- Human-in-the-loop capabilities — EAP's approval-gate model lets the agent pause at risky decision points (e.g., remediation actions that change cluster state) and request explicit approval.
- Integrated collaboration and documentation — RCA reports and remediation recommendations are persisted in EAP's audit trail and can be pushed to Jira / RCA documentation via approved MCP servers.
Automatic RCA Model 
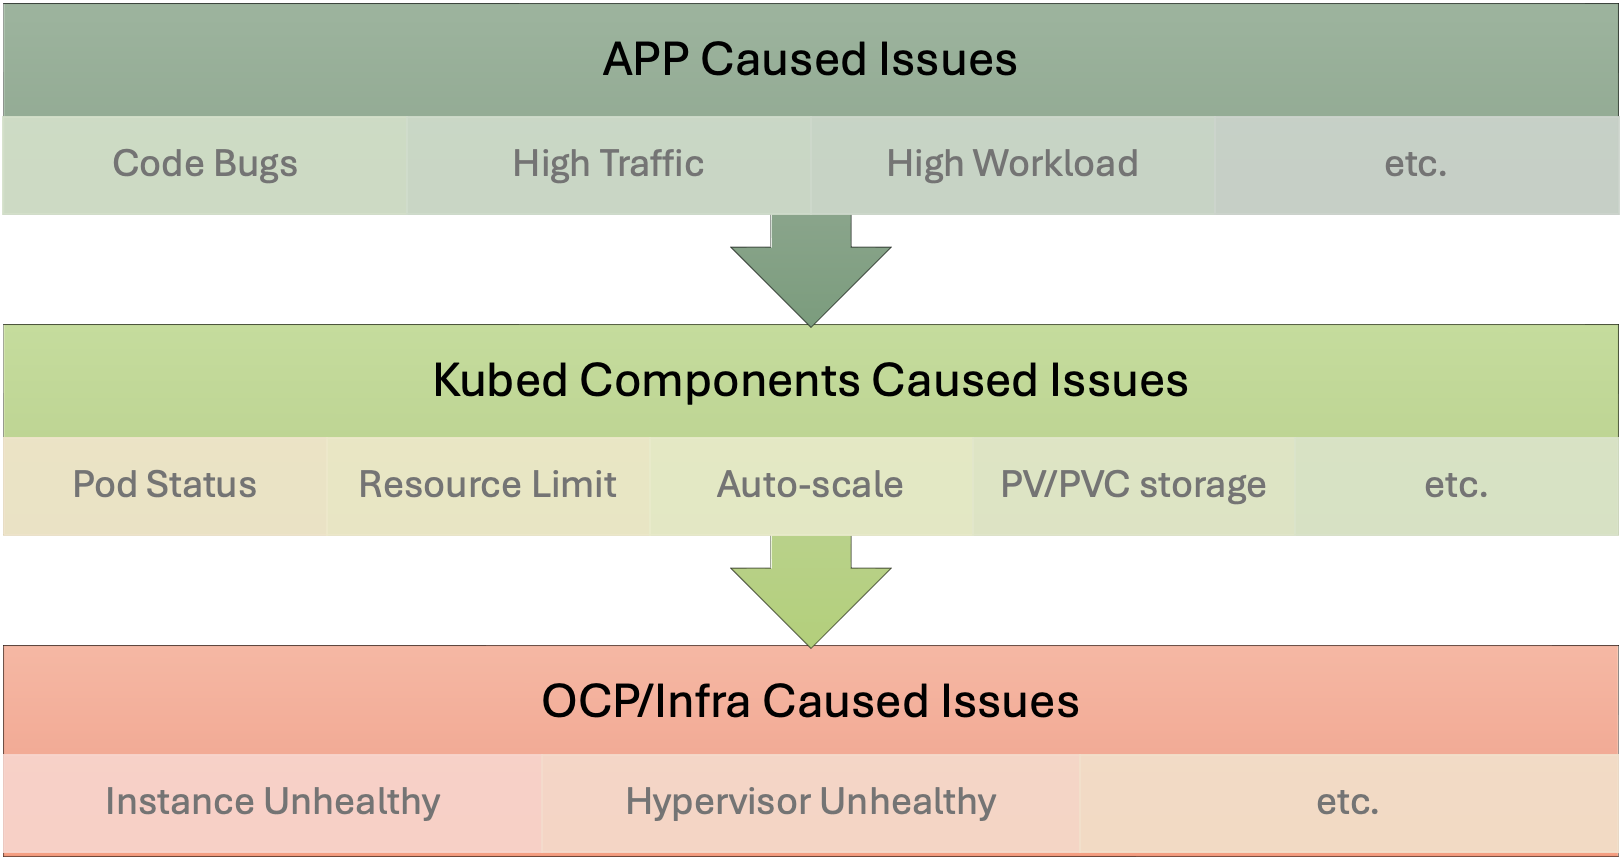
In kubernetes envrionment, the RCA model is layered, moving path is application-level -> kubed-platform -> OCP/Infra issues. That path is simulate manual troubleshooting from top to bottom layer.
The trigger of RCA workflow can be an application alert and also be a platform alert. The troubleshooting direction should always from top to bottom whereever we start our trigger.
EAP Kubed RCA Agent 
The Kubed RCA capability is delivered as an EAP agent: ingest an alert, run a series of parallel diagnostic skills against approved MCP servers, then aggregate the results through the LLM proxy to produce a report and possible remediation. The agent handles alerts from Prometheus, Grafana, and external systems such as PagerDuty or Keep.
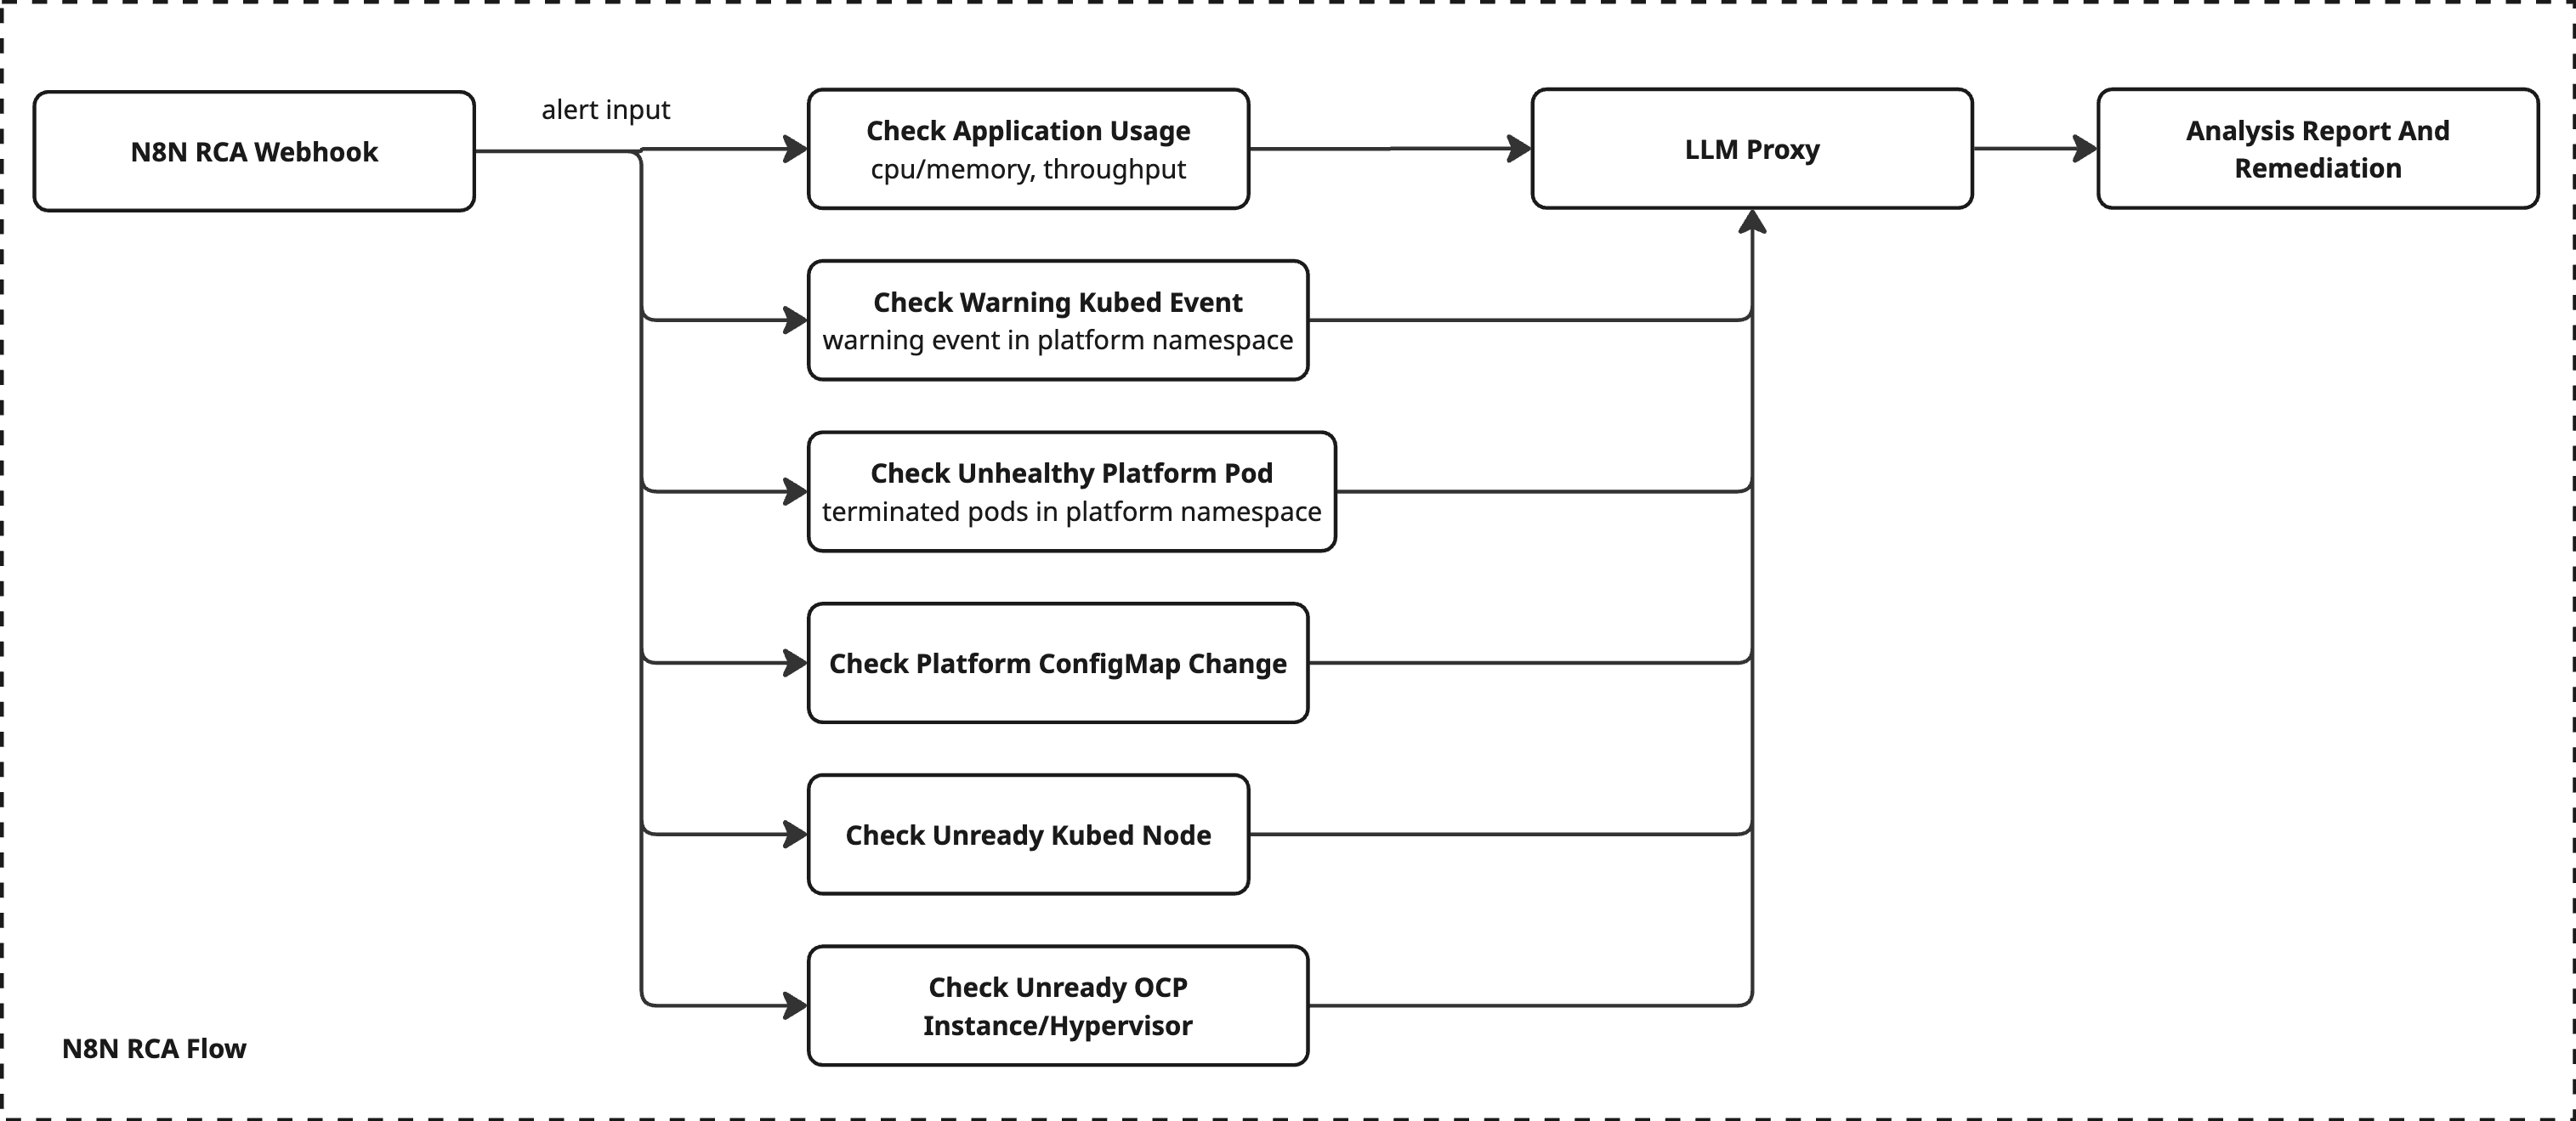
1. Trigger: EAP Simple Agent API 
Callers POST alert payloads to the agent's EAP Simple Agent API endpoint (for example, POST /agent/{team}/{project}/{agent}/api/invoke_wait or /api/invoke_stream). Sources include Prometheus, Grafana, and external systems like PagerDuty or Keep. For Keep, a Keep incident triggers the same API endpoint with the correlated alert set as input.
2. Parallel Checks 
Checks are executed in parallel to gather necessary data for analysis. These checks include:
- Check Application Usage
- Check Warning Kubed Event
- Check Unhealthy Platform Pod
- Check Platform ConfigMap Change
- Check Unready Kubed Node
- Check Unready OCP Instance/Hypervisor
3. LLM Proxy 
The agent aggregates all check results and routes them through the Cisco LLM Proxy for:
- Summarized analysis
- Root cause hypothesis
- Human-readable explanation
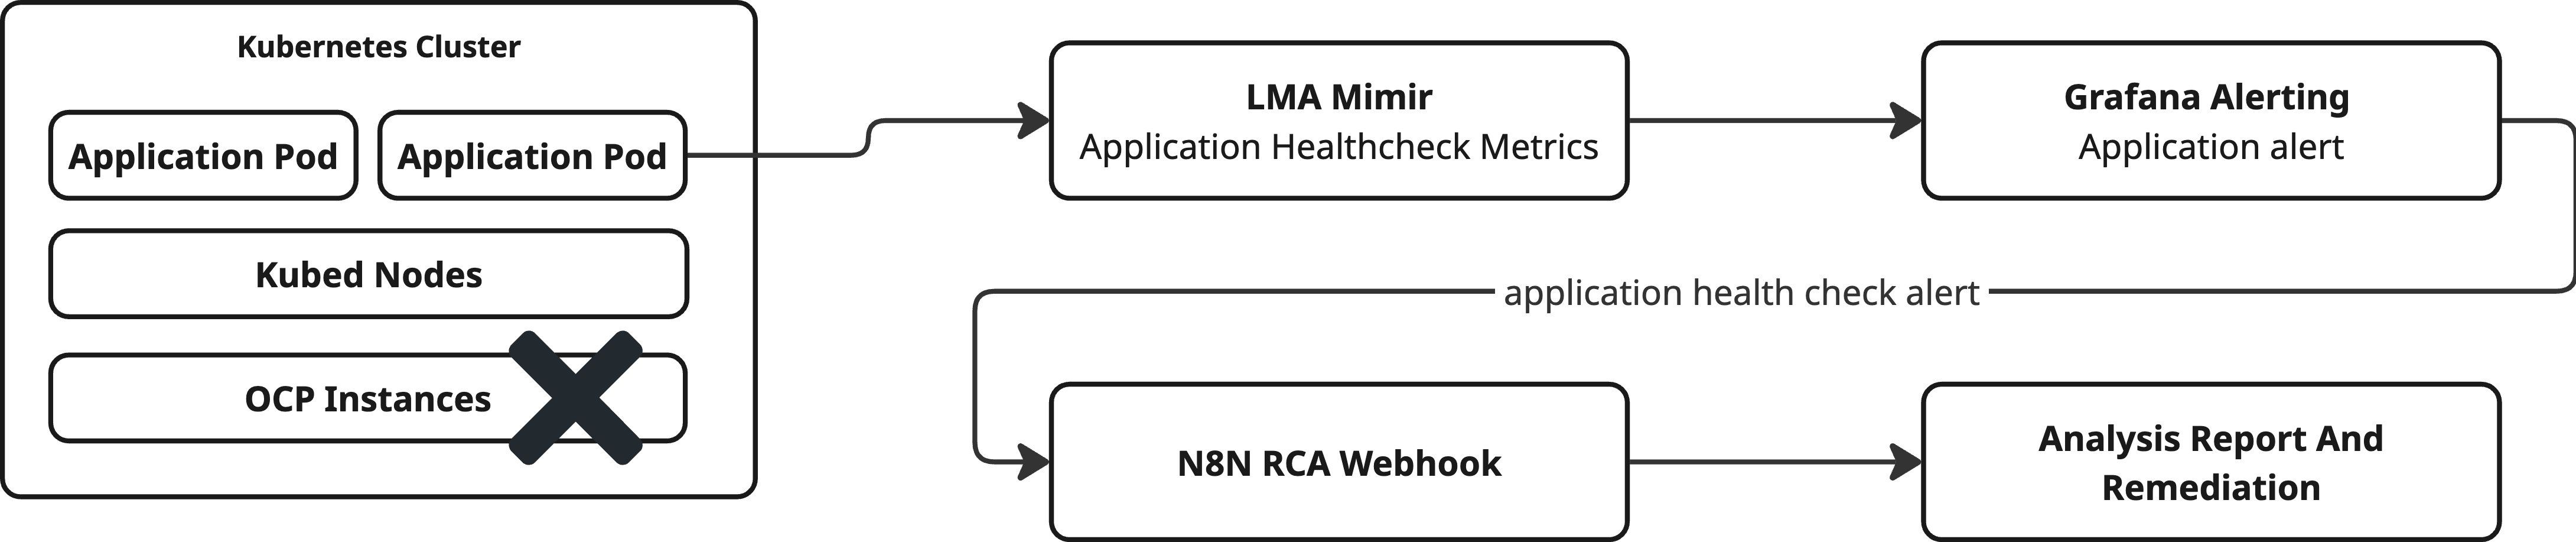
Show Case: OCP Caused Issues 
Case 1 - Shut Off OCP node used by a Kubed Cluster 
In this case, we simulate the case where an OCP instance crashed, which affected the upstream Kubernetes node and eventually made the application service unavailable. However, the troubleshooting process happened in reverse: it started with an alert for application access failure, followed by checking the Kubernetes node and then the underlying OCP instance.
Agent result with RCA report & remediation 
1. Root Cause (RCA) 
The root cause of the alert is the shut down of an OCP instance and the down status of a kubed node, which is affecting the Kubernetes cluster's ability to function correctly.
2. Analysis 
-
Check application namespace traffic, event, and configmap. And check kubed component terminated pods:
- Check application namespace usage:
- Relevance: Relevant. The sharp rise anomaly in the application namespace indicates abnormal activity that could be linked to the underlying infrastructural issue.
- Check kubed component terminated pods in kubed cluster solution-testing:
- Relevance: Relevant. The presence of terminated pods with an "Unknown" state suggests instability in the Kubernetes cluster, which could be caused by node or infrastructure issues.
- Check application namespace usage:
-
Check computer infrastructure status for unready kubed nodes:
- Check OCP instance status:
- Relevance: Highly relevant. The OCP instance
solution-testing-worker-az1-z5gt2-9sv4pis in aSHUTOFFstate, meaning that the node it is hosting is offline, leading to problems in the Kubernetes cluster. - Identified Issue: The shut down OCP instance is causing node unavailability in the Kubernetes cluster.
- Relevance: Highly relevant. The OCP instance
- Check kubelet status on kubed node:
- Relevance: Highly relevant. The kubed node
worker-454c9.solution-testing.dev.infra.webex.combeing down indicates that the node's kubelet service is unavailable, likely stemming from the shut down OCP instance. - Identified Issue: The kubelet on a node is down, preventing the node from being a functional part of the cluster.
- Relevance: Highly relevant. The kubed node
- Check OCP instance status:
3. Remediation 
- Restart the affected OCP instance to bring the node back to operational status:
# Command to start the shut-off OCP instance (this is a hypothetical command, replace with actual OCP start command)
openstack start instance solution-testing-worker-az1-z5gt2-9sv4p
- Ensure the kubelet is running on the previously affected kubed node:
# SSH into the kubed node and restart the kubelet service
ssh user@worker-454c9.solution-testing.dev.infra.webex.com
sudo systemctl restart kubelet
- Check the status of the node within the Kubernetes cluster after completing the above steps:
kubectl get nodes
- Verify that the terminated pods in the
kube-systemnamespace are either recreated or their workloads are redistributed:
kubectl get pods -n kube-system
4. Suggestion (Optional) 
-
Monitoring and Alerts:
- Enhance monitoring of OCP instances and ensure automatic alerts for any instances that enter a
SHUTOFFstate. - Implement node health checks at regular intervals to catch issues early.
- Enhance monitoring of OCP instances and ensure automatic alerts for any instances that enter a
-
Infrastructure Improvement:
- Consider using health-repair scripts that automatically attempt to restart critical services like kubelet when they are found down.
- Implement load balancer and high-availability (HA) configurations to prevent single points of failure.
-
Investigate Root Cause of SHUTOFF:
- Conduct a thorough investigation into why the OCP instance was shut off unexpectedly and apply appropriate measures to prevent recurrence.
Kubed Components Caused Issues 
Case 2 - High application traffic caused gateway crash 
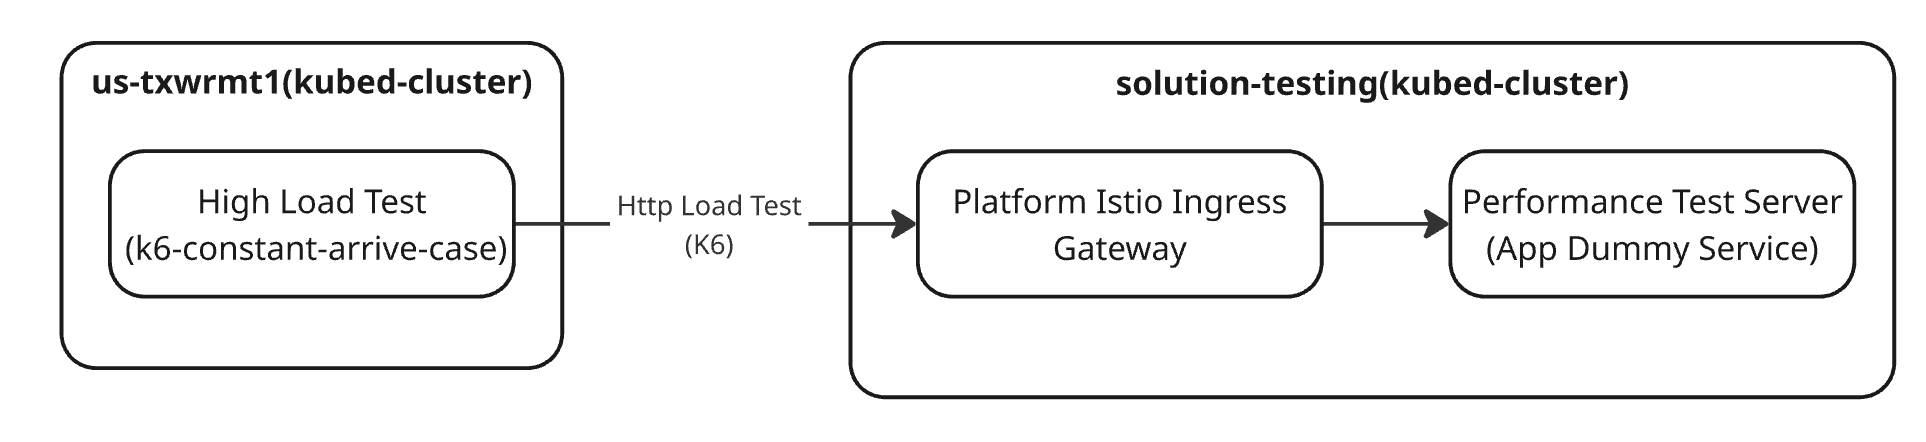
This case simulates the scenario where the client generates a large amount of HTTP traffic to access the application service's performance test server, which ultimately causes the cluster's Istio gateway to crash.
RCA Report and Remediation 
1. Root Cause (RCA) 
The alert was triggered due to an Out-Of-Memory (OOM) condition which caused the istio-proxy container within the infra-cisco-int-ingressgateway-az1 Pod to be terminated and restarted.
2. Analysis 
Diagnostic Process:
-
Evaluated terminated Pods in the mesh-platform-infra namespace to identify any container errors near the alert time.
-
Reviewed event logs and pod statuses in relevant namespaces for any irregularities.
-
Examined recent changes to the Kubed system component's ConfigMap to rule out configuration issues as a cause of the alert.
Check Items:
- Check terminated pods for namespace mesh-platform-infra
Relevance: Crucial, as this identified that the istio-proxy container experienced an OOMKilled state due to memory limitations.
Findings: istio-proxy container terminated with exit code 137, indicating an OOM (Out-Of-Memory) kill.
- Check namespace mesh-platform-infra event
Relevance: Not relevant as no abnormal events were found.
- Check mesh-platform-infra pod status in solution-testing
Relevance: Not relevant as no failures were detected.
- Check kube-system pod status in solution-testing
Relevance: Not relevant as no failures were detected.
- Check namespace kube-system event
Relevance: Not relevant as no abnormal events were found.
- Examine the Kubed system component's configMap to see if any changes were made a few minutes ago.
Relevance: Not particularly relevant as the changes were made almost a month earlier.
Identified Issue:
The istio-proxy container in the infra-cisco-int-ingressgateway-az1 Pod ran out of memory and was killed by the Kubernetes system. The container restart count (19) further indicates recurrent memory issues.
Remediation 
To immediately resolve the Out-Of-Memory (OOM) issue:
- Identify and Increase Memory Limits:
Review the current memory limits set for the istio-proxy container within the deployment and increase them to prevent future OOM kills.
- Deploy Updated Configuration:
Below is an example of updating a Deployment to increase the memory limit:
apiVersion: apps/v1
kind: Deployment
metadata:
  name: infra-cisco-int-ingressgateway-az1
  namespace: mesh-platform-infra
spec:
  template:
    spec:
      containers:
      - name: istio-proxy
        resources:
          requests:
            memory: "512Mi"
          limits:
            memory: "1Gi"
-
Apply the Configuration Change:
• Use kubectl to update the deployment:
kubectl apply -f <updated-deployment-config-file>.yaml -
Check Pod Status:
• Verify the status of the pods to ensure they are running with the updated memory settings:
kubectl get pods -n mesh-platform-infra
Suggestion (Optional) 
• Monitoring and Alerts:
Implement resource monitoring (memory/CPU) for the pods to get timely alerts if resource usage approaches the defined limits.
Use tools like Prometheus with Grafana to create dashboards and set up alerts for memory consumption patterns.
• Load Testing:
Conduct periodic load testing to ensure that the allocated resources meet the operational requirements under varying workloads and traffic conditions.
• Resource Management:
Continuously analyze the resource usage and adjust the memory and CPU requests and limits as needed based on the application performance and historic usage data.