DNS Observability
Status and Proposal 
Presently, our DNS service has established a multi-tiered self-monitoring system utilizing various tools including MCT, ThousandEyes, Jenkins+Newman, CMP, and others.
- MCT: health check on key components
- ThousandEyes: reachability check on key components exposed to external
- Jenkins + Newman + Postman scripts: Functionality check
- CMP: metrics on latency and utilization of DNS service
This is a comprehensive monitoring solution that covers a wide range of DNS service. However, it uses a large number of different monitoring tools, which can make it difficult to maintain and troubleshoot production issues.
For both DNS service owner and central operation team, It's better to have one place to show all the health status and get more precisely alerts.
This proposal aims to consolidate all essential paths monitoring within a single platform. This platform would provide real-time health status updates of the DNS service and alert users when necessary.
The proposal offer the following advantages:
1. One place to view the service health status and detail alert info
2. Precise aggregated alerts with minimized noise
Alerting silence configuration
Integration with Change Management Processes * Multi-tier aggregated alert escalation rules
3. Flexible manual testing: Execute on-demand testing scenarios
4. Kubed/NonKubed, Fedramp/Commercial, one solution
Overview 
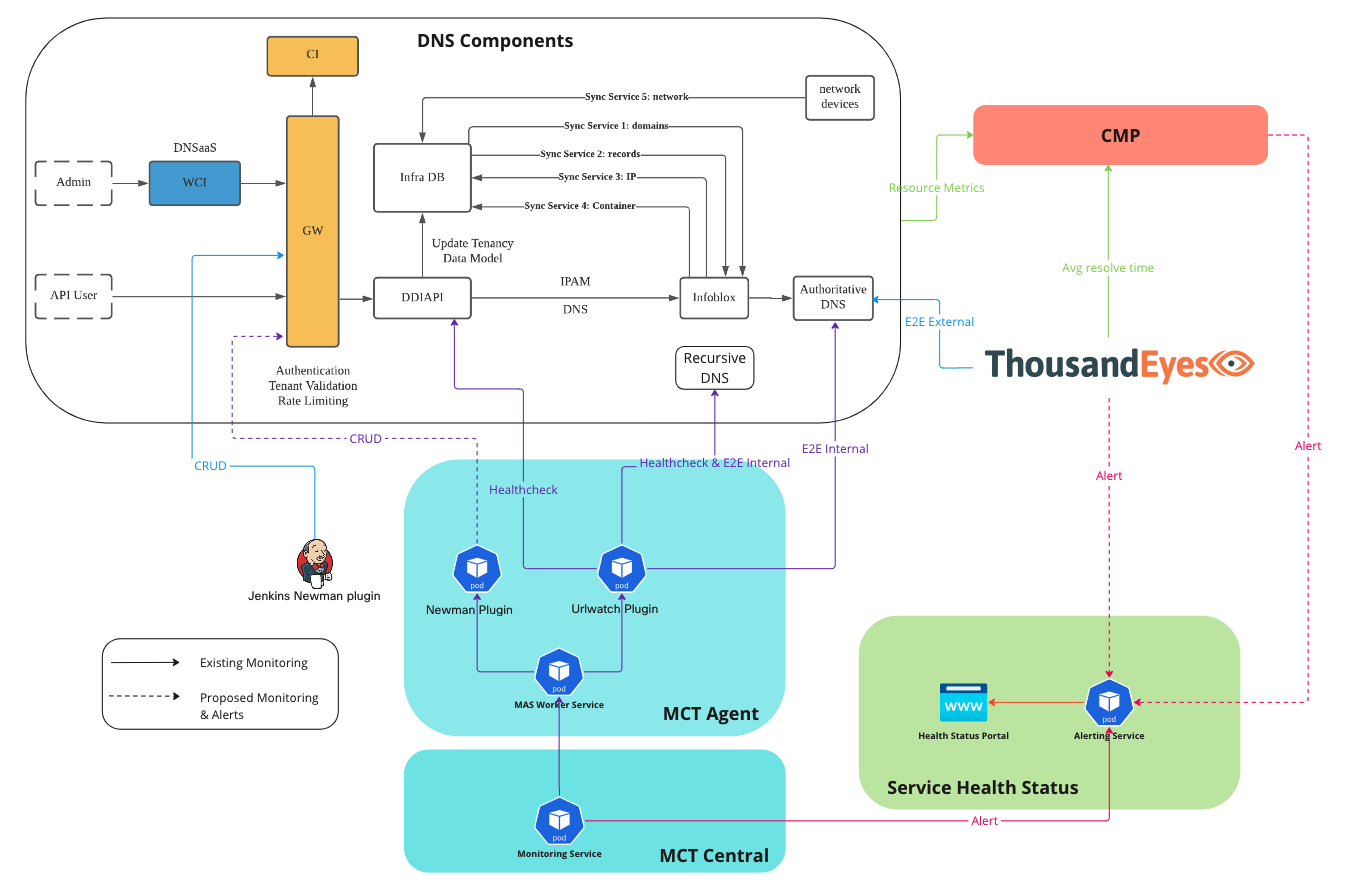
Status 
- DDIAPI Functionality(CRUD) monitoring is triggered by
Jenkins+Newmanand test case write as a Postman script - DDIAPI & DNSaaS & IBProxy healthcheck via
MCTURL Watch - Recursive service static internal E2E test via
MCTURL Watch - Authoritative service static internal E2E test via
MCTURL Watch - Authoritative service static external E2E test via
ThousandEyes - E2E test starts from call DDIAPI by self develop service result in
CMP - DDIAPI Unexpected Error Count alert in
CMP - All DNS components resource and usage metrics in
CMP
Proposal 
What: Centralized Monitoring and Alerting 
Since MCT already takes an important role in DNS monitor, we should make it able to cover more. And aggregate alerts from different monitor tools together for show the service health status.
- Take over the DDIAPI Functionality(CRUD) monitor by using
MCT - Forward the alert from
CMPandThousandEyestoService Health Status Service Health Statuscan show the DNS components health status based on alert fromMCT,CMPandThousandEyesand do proper alerting after aggregation.- Integrate
Service Health StatuswithApdexto correlate the customer impacts with internal failures
How: Functionality Monitoring Enhancement 
- Build Newman plugins in
MCTable to trigger critical path DDIAPI CRUD monitor - Get the read access of test case git repo so
MCTcan auto read and register check - Add webhook in test case git repo to keep test cases updated
How: Unified Service Health Status 
- Add/modify alert rule in
CMPto forward alert toService Health Statuswebhook receiver. - Add/modify alert rule in
ThousandEyesto forward alert toService Health StatusService webhook receiver. - All the rules should contain meaningful label.
PS: the hierarchy of each section in Service Health Status Portal will be align with Backstage:
Domain - Platform
  ->System - DNS
    -> Service - Authoritative
        -> MCT ens healthcheck
        -> ThousandEyes E2E
    -> Service - Recursive
    -> Service - DNSaaS
    -> Service - Ibproxy
Newman plugins 
Option 1 
Install newman client in every mct agent and use newman run sample-collection.json as commandline for plugin
Reference: https://github.com/postmanlabs/newman#using-newman-cli ### Option 2 JS use newman as a Node.js module and run
const newman = require('newman'); // require newman in your project

// call newman.run to pass `options` object and wait for callback
newman.run({
    collection: require('./sample-collection.json'),
    reporters: 'cli'
}, function (err) {
    if (err) { throw err; }
    console.log('collection run complete!');
});
Reference: https://github.com/postmanlabs/newman#using-newman-as-a-library
DNS Postman testcase: https://wwwin-github.cisco.com/webex-iaas/dnsapi-tests
Forward Alerting to UAS 
Grafana Alert 
Edit alert rule setting in CMP and add UAS webhook interface as notification target.
ThousandEyes 
In ThousandEyes Alert Rule setting configured UAS webhook interface as notification target.