Introduction to MCT (Monitoring Console Tool) 
MCT (Monitoring Console Tool) is a centralized Synthetic Check system used for monitoring Webex services. It is designed to provide a global view of the system's health and performance, with the ability to configure and monitor multiple instances across different locations. The tool collects data from various sources and provides real-time visibility into the system's healthy status.
Use Cases 
flowchart LR
    Definition --> Registration --> Observation --> Decommission
    Observation --> Alerting --> Observation
State Cycle 
    flowchart TD
        A>definition] --> B[registration]
        B -->|set timer| C[running]
        C -->|maintain| D[maintenance]
        D --> E[snooze]
        C -->|offline| F[offline]
        D & E & F -->|unmaintain| C
        F --> G>decommission]
        B -..-> G
        G -..-> A
Definition 
The Definition phase is where the monitoring journey begins. In this phase, users define the scope and parameters of the synthetic checks they want to conduct. This involves specifying the target application or service, determining the user interactions to be simulated, and configuring the expected behavior and performance thresholds. For complicated scenarios based monitoring behavior, requester maybe needs to contact with an MCT developer to discuss a proper monitoring solution.
What 
There are multiple questions to answer at this phase:
| Question | Clarification |
|---|---|
| 1. What monitors do you want to apply? | What monitors can we provide? |
| 2. Is there any business-specific monitors need to develop? | For specific monitors, what is the business logic? and what is the output? |
| 3. What datacenter/clusters need to enable? | What locations can we provide? |
| 4. Where are the probe checks coming from? | What are the available monitoring agents? |
| 5. What environments need to provision? Commercial or Fedramp, or both? | What are the limitations or differences to enable the check considering the environment? |
| 6. What are the notification channels? | What notification channels can we provide? |
| 7. Which is the best option for the scenarios or failure severity or scope? | What scenarios can each notification channel match with? |
Means there should be a monitor map including a check type and location
Registration 
Once the checks are defined, they need to be Registration within MCT. During this phase, users set up the necessary checks with proper configurations, and suitable intervals. MCT provides a user-friendly interface and yaml file repository to streamline the process of registering checks, enabling users to create dynamic and accurate simulations of user interactions.
How 
In this phase, we need to answer the question of How, for Add/Edit/Disable/Delete and should focus on Automation but also include Manual.
In Automation mode, we need to provide Hello World for users to copy from, with detailed configuration explanation.
| Question | Clarification |
|---|---|
| How to register/edit/disable/delete a check in MCT? | What is the registration process? How can we enable self-service? |
| How to set the interval? | How to set up the interval? |
| How to set the location? | How to pick up the agent location? What's the difference among them? |
| How to trial run the check? | After setting up, how can we do a trial run to see if the check is working? |
| How to enable/search/modify/disable/delete an escalation rule? | How to easily enable an escalation rule? |
In Manual mode, it will apply on ad-hoc scenarios, and also in manual adjustment after setup.
Besides the definition of observation target, users of MCT also need to provide Service Impact Rule to call out failures with proper policies and notifications receivers.
Observation 
The Observation phase involves the actual execution of synthetic checks. MCT orchestrates the scheduled simulations across different locations and environments. The tool records response times, interactions, and outcomes, generating detailed reports that highlight deviations from expected behavior. These reports offer insights into performance trends, allowing organizations to pinpoint and address potential issues promptly.
What 
| Question | Clarification |
|---|---|
| What is the failure? | What's the failure? What is the scope? What is the responsible agent? Which is the first alert? |
| Is it a true alert or just happen in MCT? | Is is impacting end user?, or is it an issue with MCT's monitoring itself? |
| What are other supporting clues like wireshark? | What supportive information can we provide from tools such as Wireshark or other logs? |
| What is the context information of that failure? | Is there any change going on? What's the resource status of the target server and agent? Are there any recent changes or events that could be related to the failure? |
How 
- How to show the failures?
- How to show up the error message?
- How to get the supporting clues?
Alerting 
Alerting is not a separate phase, it is one of the scenarios happened in Observation phase when failure happened. MCT ensures that relevant stakeholders are informed of any deviations from expected performance. The tool can be configured to send alerts, notifications, or reports to designated recipients via various communication channels. This proactive approach empowers organizations to respond swiftly to emerging issues, thereby minimizing the impact on end-users.
What 
- What is included in notification?
- What other monitoring tools can tell?
How 
- How to snooze?
- How to escalate?
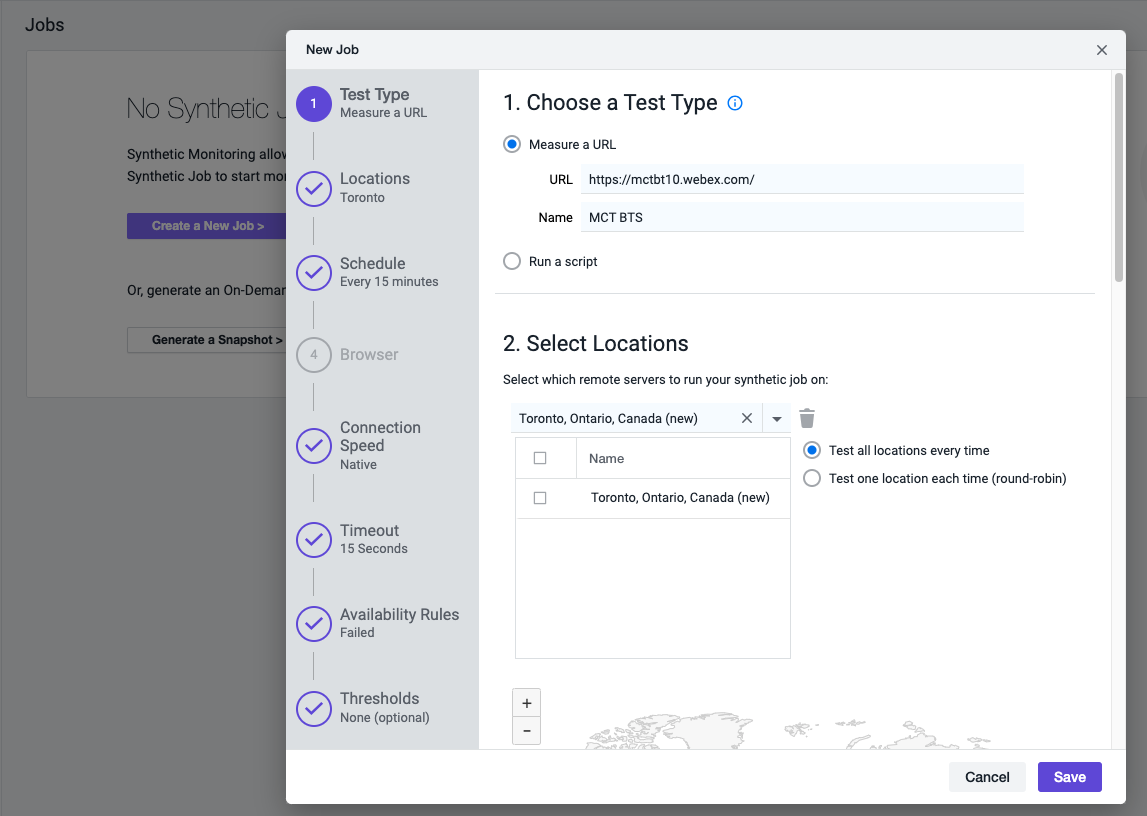
Example: AppDynammics 
UX Design 
Cluster View 
The purpose of cluster is to make sure all the observations targets under either physical or logical services or sub services could be manageed together, group with different zones then add checkes on each observation targets.
Behavior 
- Add/Edit/Delete
cluster - Add
zone - Manual test on all the
checkunder thiscluster - Set Timer for all the
zoneunder thiscluster - Maintain/Snooze/Recover from specific states
New Cluster 
- Cluster Type - deprecated
- Cluster Name - required. Need to give naming convention suggestion
- Data Center - required.
- MCT Service - deprecated
- Environment - optional. required?
- Primary/GSB - pending for discussion
- Fails over to Cluster - deprecated
- Failover Check URL - deprecated
- Conference ID Group - deprecated
Zone View 
New Zone 
- Cluster Name - required, pre-filled
- Zone Group - deprecated ?
- Zone Type - required General or Webex Specific
- Zone Name - required provide naming convention
- Key Zone - deprecated how to adjust the alerting policy based on key zone
Check View 
- Check Type - required
- SvrType - deprecated
- Instance Type - deprecated
- Zone Name - required pre-filled
- Key Zone - deprecated
- Check IPAddress - required
- Check Hostname - required